
Trust.Kovrr
Achieving Accurate Likelihood Probabilities for Cyber Events
Rates of Cyber Events
A slight change of 2% when modeling the likelihood of suffering from a cyber event can cause up to 30-40% increase in an annual overall loss.
There’s no way around it. If you really want to have accurate numbers for cyber risk quantification of cyber events, then you need to have great frequency data. It’s not enough to have great cyber data - you need to group and analyze the data correctly to properly predict your probability of suffering a cyber attack.
How Can You Analyze the Frequency of Cyber Events for Cyber Risk Modeling?
Cybercrime and the variables involving data loss cannot be quantified in the same manner as in other industries. Reliable data has been sparse, and the technology landscape is fluid and constantly evolving. The fast pace of change makes it difficult for corporations to rely solely on past data of the industry.
The challenges of predicting frequency of cyber events includes: lack of data or very sparse data stemming from enterprises not willing to expose themselves, the natural chaotic dynamic of cyber events, understanding the natural target population of certain events, etc. This means combining, testing, validating and analyzing frameworks, modeling approaches and using different types of analysis techniques, to create the most accurate and realistic frequency distribution.
According to Kovrr’s simulations, even a slight change of 0.02 in frequency of cyber events can cause up to 30-40% increase in the annual overall loss.
The aim of this paper is to shed light on this issue and come up with frequencies of different types of cyber events. Using smoothed, aggregated data Kovrr tested different time-series algorithms for building a frequency distribution broken down into event types. One approach was using observation driven models, ARIMA (Autoregressive Integrated Moving Average) models and LSTM (Long Short-Term Memory) which are both observation driven models. Comparing this method with other approaches proved to be significantly better in capturing long term trends, cleaning noise perturbations and fitting the curve of raw observations.
Alternatively, parameter driven models assume that the dynamic process is a function of the latent parameters of the model. In these kinds of models, the latent parameters of the distribution are a function of the unobserved dynamic process. Negative binomial regression belongs to the second approach and is the natural regression technique to infer a poisson-distributed response variable (count-based data or rates).
The advantages of this approach are that we can directly model the relationship between revenue and industry division to outcome rates. Nevertheless, this led to higher errors. Additionally, this approach assumes non-correlation between observations which contradict the way we have constructed our data (we have addressed this issue with some further preprocessing of the data, dealing with auto-correlated residuals). Eventually LSTM provided the lowest residuals but the differences between ARIMA and LSTM encouraged us to use a hybrid model (consisting of both of them) as our final predictions for data breach events (for ransomware we have used a model based solely on LSTM).
To learn more about our methodology, read the full research paper here.
Summary of Findings
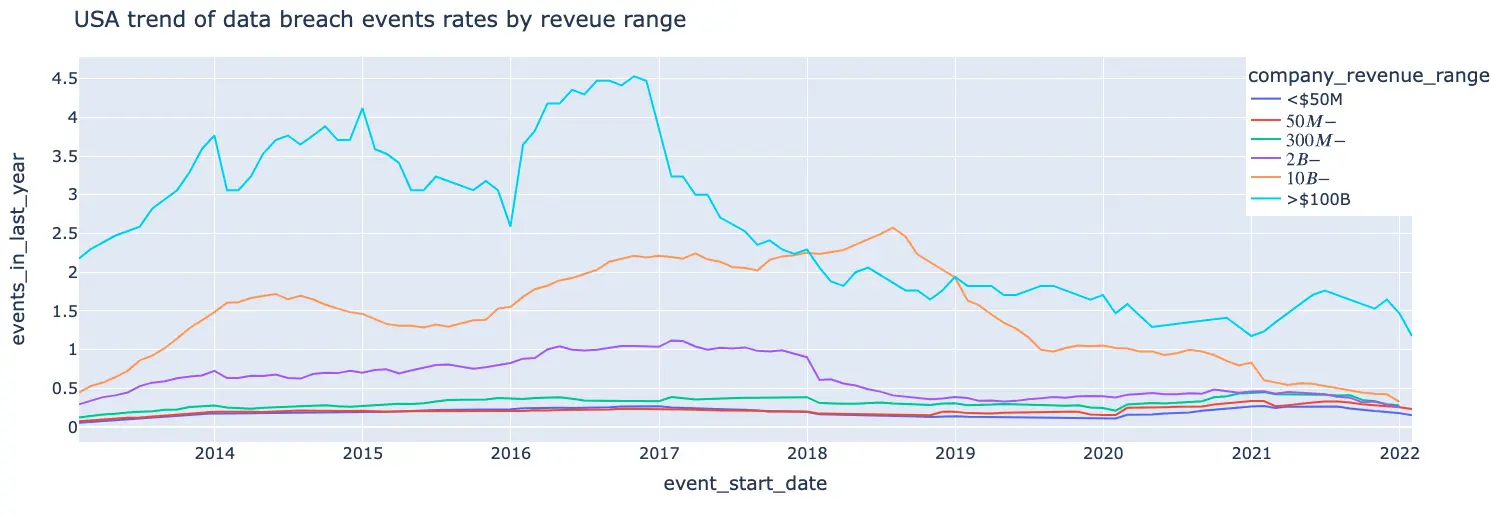
- Data breach rates for finance and retail trade industries are steadily higher than the rest of the industries throughout our entire time frame (2013-2022)
- Finance and retail trade have remarkably high rates between 2016-2019 (especially extreme peaks were found in mid 2018 with almost 2 events per company).
- The predicting rate for data breach events for both finance and retail trade industries (approximately 1 event every 3 years) are almost 2 times higher than our average predicted rate for all other industries.
- There was a sharp decrease in data breach events for the services industry in 2018 after which it plateaued around ~ 0.07 (7 events in 100 years). In general, data breach rates seem to be a bit noisy, but with moderate fluctuations providing a reasonable (not too chaotic) signal for predictions.
- A rapid increase in ransomware rates since mid 2020 which lasted until mid 2021 (since mid 2021 we observe a drop down which we believe is partially an artifact of delayed disclosures of events).
- There is an inverse correlation between revenue range and ransomware rates - for higher revenues it is less probable to suffer a ransomware attack (extra small companies < 50M do not obey this rule as we can see they are likely to suffer a ransomware attack approximately once in every 10 years which is about half of the rate we have predicted for small-medium companies - 50M-300M).
These findings clearly correlate with real world cyber event data. For example, 2018 was a “boom” year for ransomware, and both the finance and retail industries are extremely popular targets. Additionally, there was a substantial surge in bitcoin miners active at the time (this has since decreased), which may have also contributed to the high number of events. Another example relates to the ransomware findings. Coordinated actions of nations and cyber companies to bring down ransomware infrastructure and to find and arrest ransomware actors brought down several actors, and new actors moved quickly. They also avoided attacking huge targets because they didn’t want to expose themselves.
Why Use Cyber Risk Quantification?
Generally, companies turn to cyber risk quantification (CRQ) to understand and limit the company’s risk to the business, both in terms of identifying potential areas where risk-reduction can take place, and where risk-transfer (through insurance) would be appropriate. Today, business executives are recognizing the need to re-assess cyber security initiatives to better understand how their current security posture can expose their company to unforeseen losses. Leadership needs to be aware of how a cyber event can impact budget expenditures and understand if the return on investment (ROI) is meeting identified goals.

