Start Negotiating Cyber Insurance With Quantified Data
Kovrr's Insurance Data Insights maps an organization's modeled cyber exposure directly to its coverage terms, supporting both standard and tower insurance structures, and giving security and finance leaders a shared, data-driven basis for evaluating coverage before renewal conversations begin.
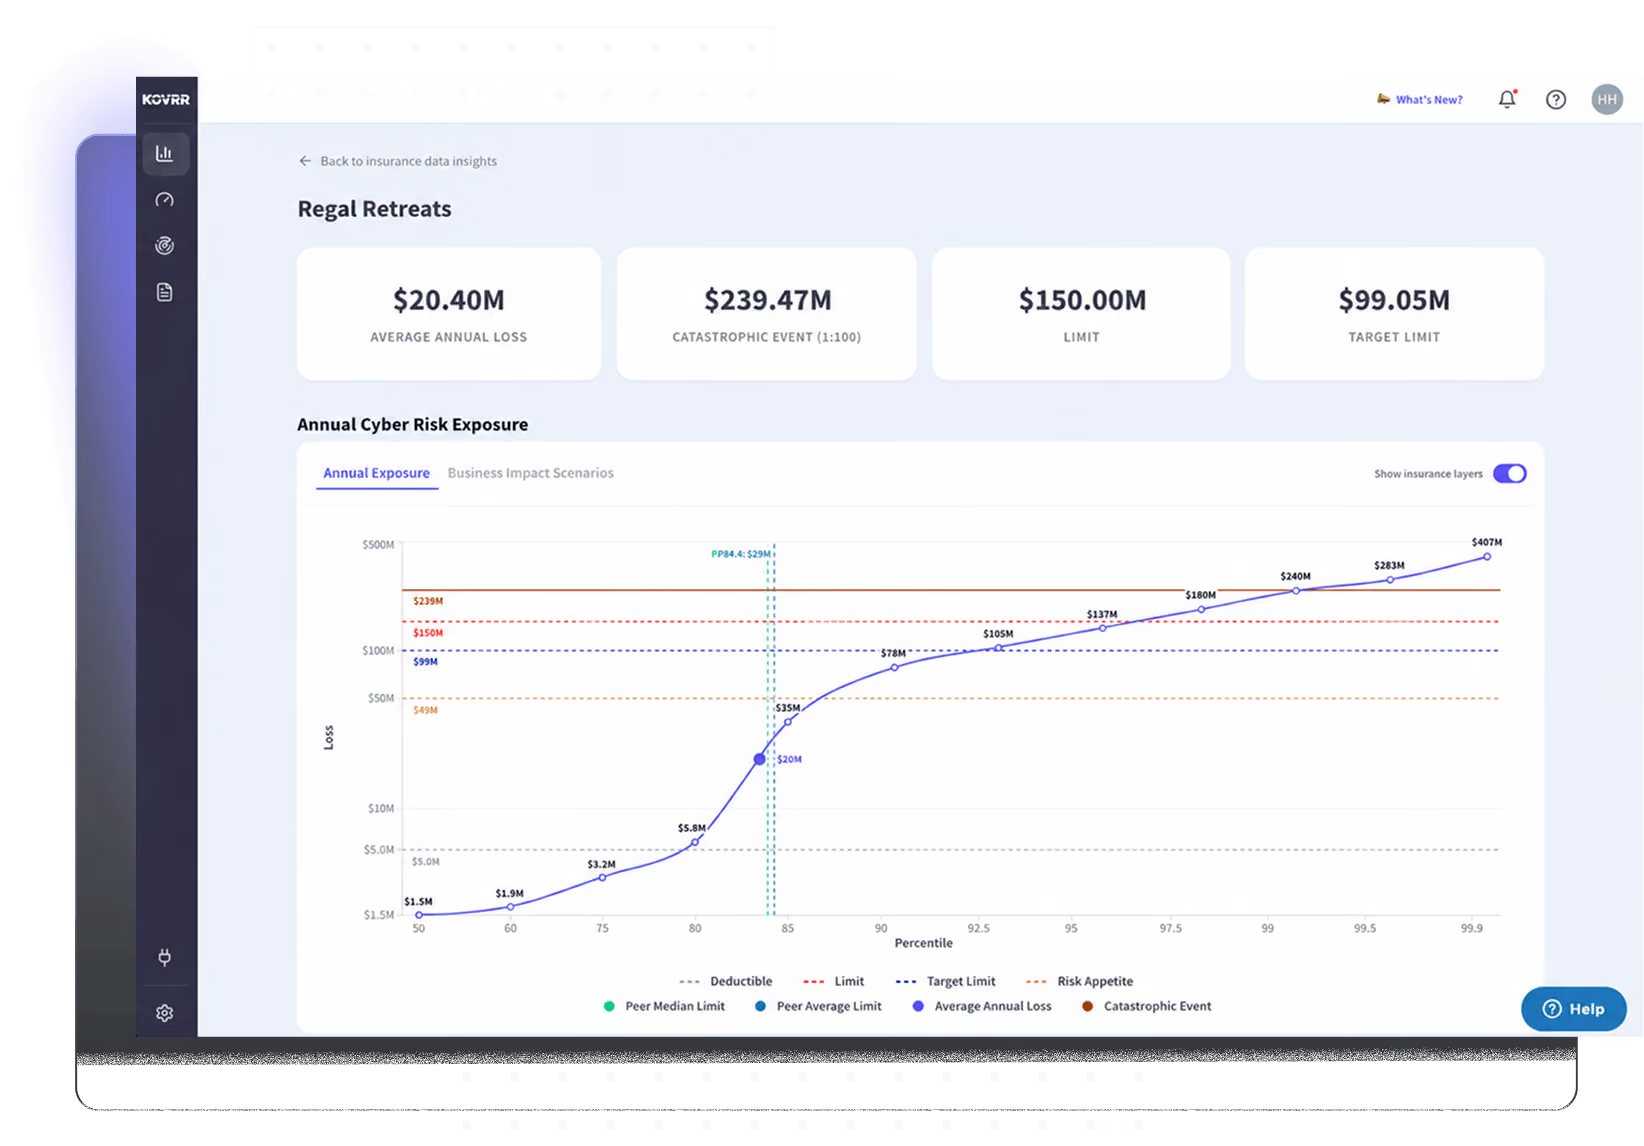


See How Coverage Compares Against Modeled Loss
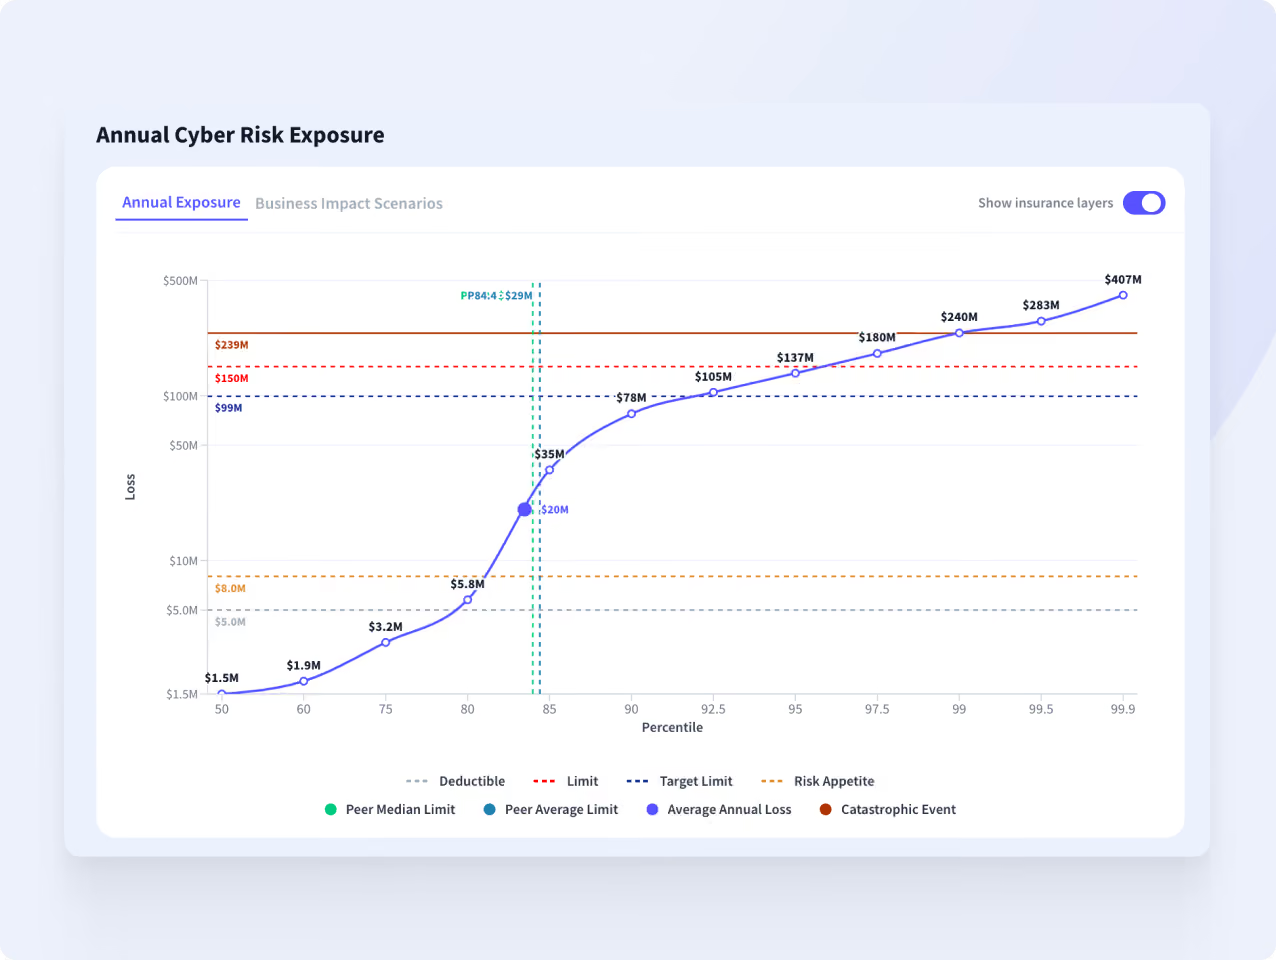
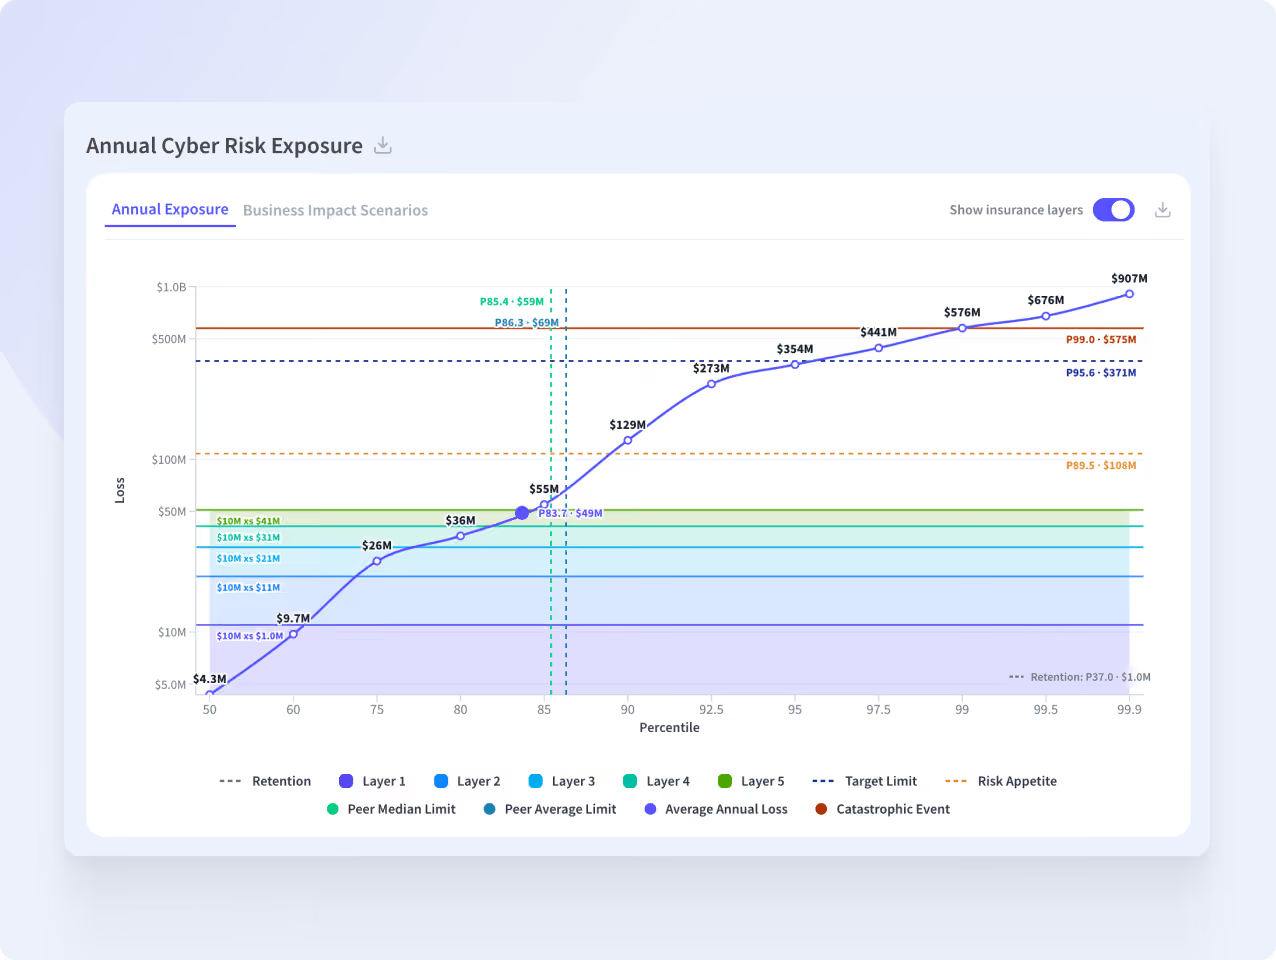
The Annual Cyber Risk Exposure curve overlays an organization's insurance terms directly onto its modeled loss distribution. Limits, deductibles, risk appetite, and peer benchmarks are all visible in a single view, making it immediately clear whether current coverage reflects the organization's quantified risk profile.
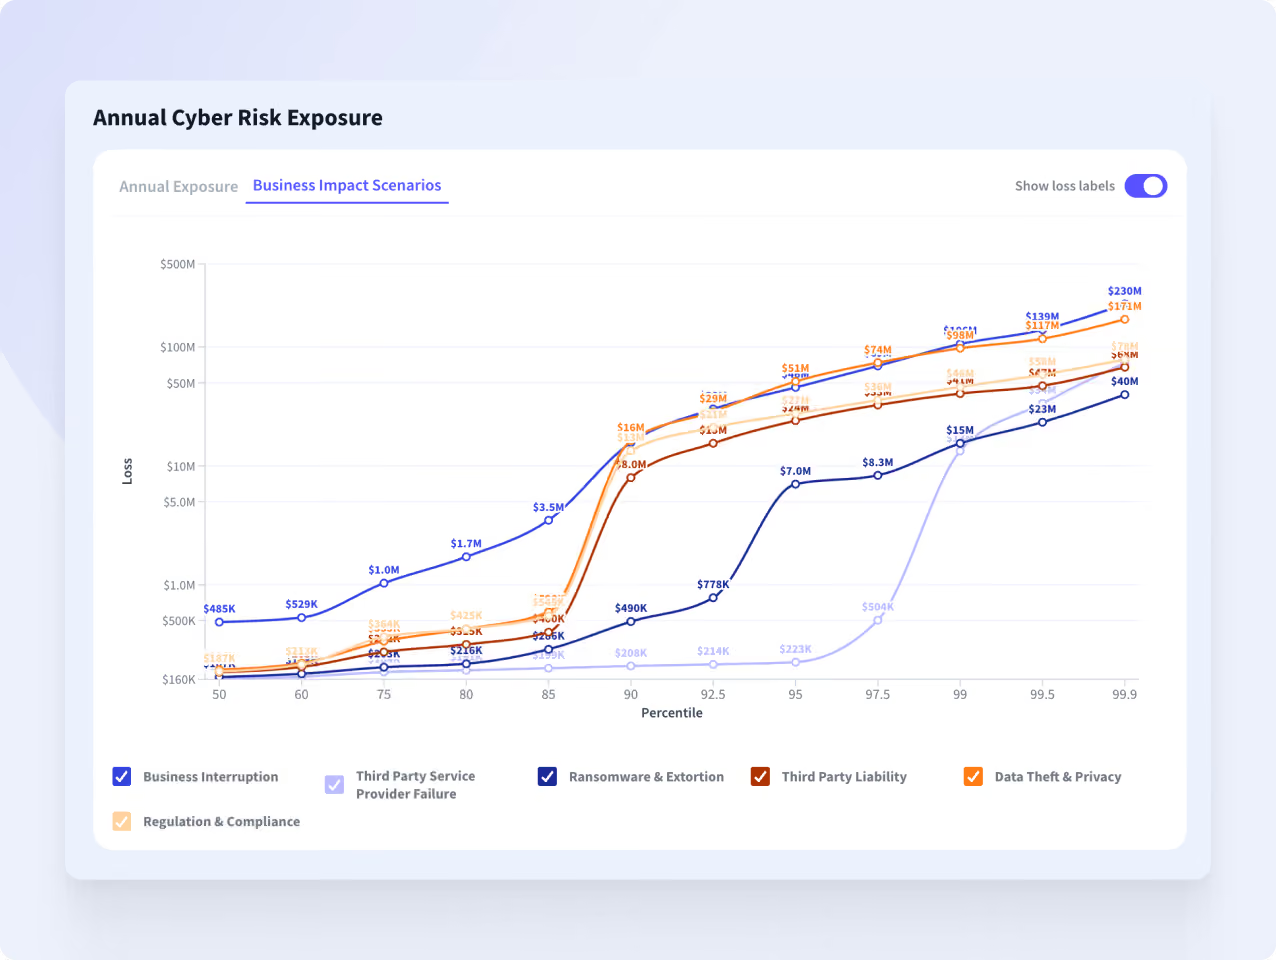
Drill Into the Scenarios That Shape the Negotiation
The Business Impact Scenarios view breaks the loss distribution down by event type, organized around the categories most commonly referenced in cyber insurance underwriting. Each scenario is plotted separately, making it possible to see where losses concentrate and which events are driving the most risk at different severity levels.
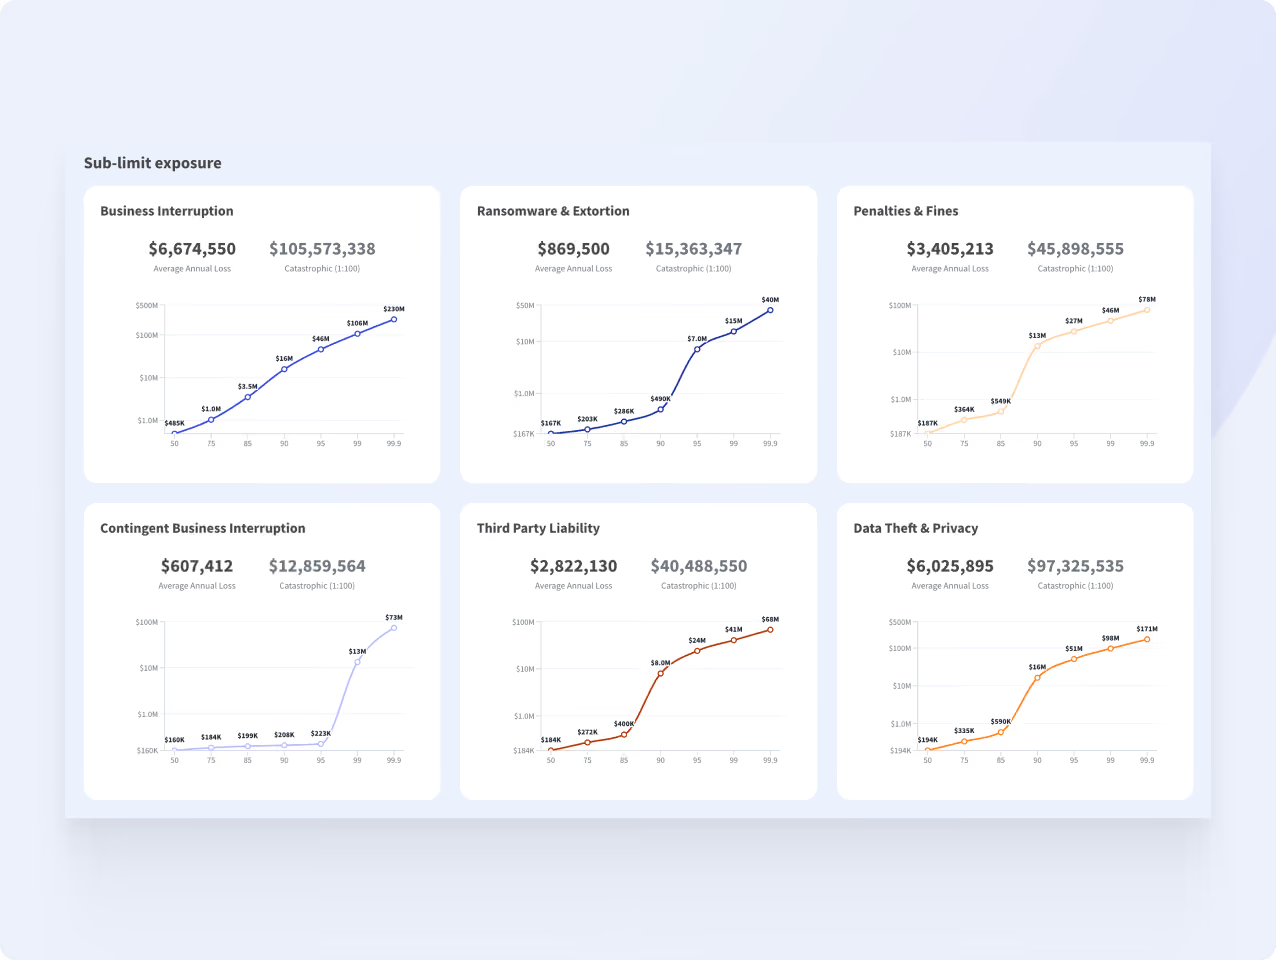
Know What Each Part of a Policy Needs to Cover
The Sub-limit Exposure section models loss across six event categories commonly structured as sublimits in cyber insurance policies, including Business Interruption, Ransomware & Extortion, Penalties & Fines, Contingent Business Interruption, Third Party Liability, and Data Theft & Privacy. The category breakdown gives organizations the data needed to evaluate whether existing sublimits reflect their risk profile.
Optimize Every Layer of a Tower Program
Insurance Data Insights supports full tower configuration, with each layer defined by its limit, excess point, and annual premium. The Tower Insurance Optimization table then breaks down the economics of each layer, surfacing modeled AAL, current premium, premium multiple, and rate-on-line metrics across the full stack, making it possible to evaluate whether each layer is appropriately priced.


17% Lower Premiums. Here's How One Organization Got There With Kovrr.
A European private equity firm managing over 50 portfolio companies used Kovrr to quantify cyber exposure across its entire portfolio. Armed with modeled loss data for each entity, they walked into broker negotiations with hard evidence and walked out with a 17% reduction in cyber insurance costs.

Cyber Insurance Insights FAQs
Optimize Cyber Coverage NowHow can cyber risk quantification help reduce insurance premiums?

How do I know if my cyber insurance limit is right for my organization?
What is a cyber insurance tower program, and how does it work?
What are sublimits in a cyber insurance policy?
How does Kovrr's Insurance Data Insights connect to the CRQ platform?
Which teams should be involved in cyber insurance decisions?
