Aggregate Cyber Risk Across Your Entire Portfolio
Managing cyber risk across multiple entities means dealing with different threat environments, tech stacks, and exposure profiles, all at once. Kovrr's Portfolio Analysis brings it all together, giving risk managers a single, aggregated view of where exposure originates and how it compounds across the group.
Get a Free Demo

Set Up a Portfolio Analysis in Minutes
Kovrr's cyber risk portfolio analysis builds on the individual entity modeling already completed in the platform. Once your entities are quantified, grouping them for a portfolio-level view is straightforward
Name your group and select a minimum of two entities to include
Set a correlation value that reflects how losses across those entities are expected to interact
All entities within a group must share the same currency to ensure financially coherent aggregated outputs

Quantify and compare cyber exposure across portfolio companies pre- and post-acquisition, and understand how risk concentrates at the group level.
Monitor and compare cyber risk profiles across clients, with the financial metrics needed to prioritize action and demonstrate value.
Assess systemic exposure across insured entities or departments, accounting for shared dependencies and correlated losses.
A Complete Picture of Cyber Risk, From Entity to Enterprise

Correlated Loss Modeling That Reflects Reality
Cyber risk doesn't simply add up across entities. Shared dependencies and overlapping attack surfaces mean losses interact in ways that individual entity modeling alone won't capture. Portfolio Analysis accounts for that correlation, producing exposure figures that accurately reflect how losses materialize at the group level
Top-Line Exposure at a Glance
Once the analysis runs, the results dashboard immediately surfaces key exposure metrics, including Average Annual Loss, 1:100 Annual Loss, and the entities and correlation setting that shaped the analysis. A financially grounded starting point for any portfolio-wide risk conversation.


Understand Which Entities Are Driving Risk
The Entity Risk Capital breakdown shows each entity's individual AAL, 1:100 Annual Loss, and percentage contribution to the group's total exposure. Risk managers can immediately see where concentration lies and which entities deserve the most attention.
Drill Into the Factors Shaping Exposure
Go beyond the numbers with risk driver analysis. See which event types occur most frequently across the group, which MITRE ATT&CK vectors are contributing most to financial exposure, and which shared technologies are quietly compounding risk across entities.
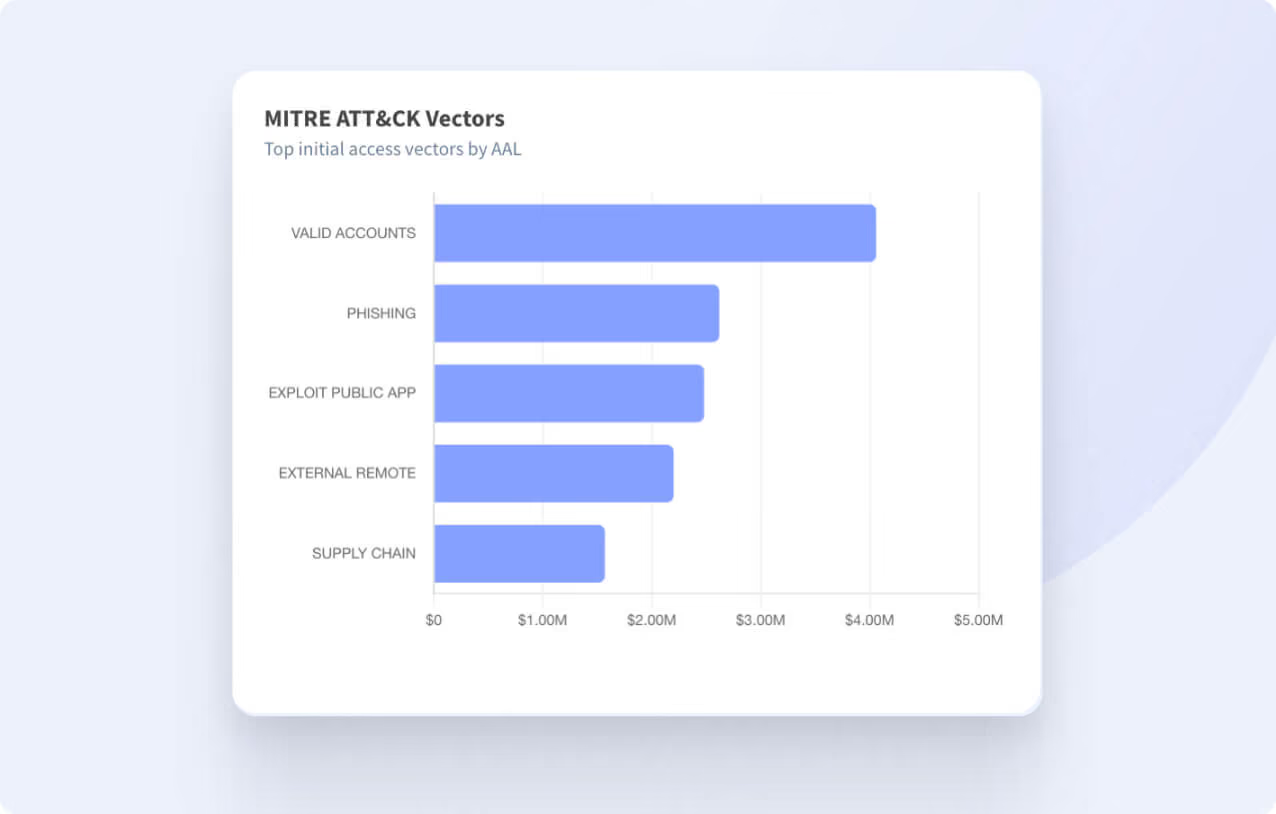

Trace How Losses Flow Across the Portfolio
The Event Summary and Event Distribution views map how each entity contributes to the financial impact of each event type, and how those contributions converge into the group's total exposure. Concentrations that would be invisible in a traditional table become immediately clear.

How One PE Firm Cut Cyber Insurance Costs by 17%
A global private equity firm used Kovrr's Portfolio Analysis to get a clear, correlated view of cyber exposure across all portfolio companies. With loss exceedance curves and aggregated risk metrics in hand, they walked into insurance negotiations with data and came out with significantly better coverage at a lower cost.


Why Quantify Risk With Kovrr?
Kovrr's models are built on privileged cyber insurance claims data, millions of loss data points, and continuous global event intelligence. The result is a level of accuracy and calibration that goes well beyond conventional risk scoring or framework-based assessments.
Every output, from Average Annual Loss to loss exceedance curves, is expressed in financial terms that resonate with executives, boards, and finance teams. No translation required, no subjective scoring to explain away
Whether you need exposure figures at the individual entity level, the business unit level, or across an entire portfolio, Kovrr delivers a consistent, correlated view at every level of your organization's structure.
Kovrr connects with your existing security tools and third-party systems to pull in real asset and vulnerability data, reducing manual input and ensuring portfolio assessments reflect your actual environment and not assumptions.
Cyber Risk Portfolio Analysis FAQs
Schedule a DemoCan I compare cyber risk across multiple portfolio companies or business units?

Can this help reduce overall cyber insurance costs across my portfolio?
How does Kovrr account for the differences between each portfolio company?
How much effort does it take to onboard a full portfolio?
