
Blog Post
Accurately Assessing Cybersecurity Risks With the CRIMZON™ Framework
May 24, 2021
A cyber catastrophe hits, and yet there’s no sound. In many cases no one notices any interruption or damage for weeks or even months. Meanwhile, the financial losses mount.
The intangible nature of cyberattacks is what makes these events so concerning to both the businesses facing the threats as well as the insurance carriers helping them mitigate the financial consequences. But for insurance carriers there is the added concern of potential accumulations. How can they understand their exposure and potential loss to such an unknown, evolving area?
Fortunately, there are now more ways to assign a dollar value to cyber risk exposure, such as with Kovrr’s open framework Cyber Risk Accumulation Zones (CRIMZON™). This paper discusses how to use the CRIMZON™ framework to better analyze the aggregations of risk within insurance portfolios and, further, how to use this to optimize your portfolio.
CRIMZON™ help insurers analyze cyber accumulations, similar to how property insurers might use geographic zones. By placing limits within CRIMZON and summing them up, insurers can then understand the full amount of their exposure. Yet cyber risks are multidimensional in nature and not limited to any one geography, therefore CRIMZON group organizations together based on the following three factors:
1. Location
The framework uses country-level data worldwide and state-level granularity in the U.S.
2.Industry
Organizations are grouped based on the SIC classification system with additional options for more granularity.
3. Entity Size
Commonly used revenue bands are applied to group companies of similar sizes together.
These factors are used because companies that share these characteristics tend to experience similar cyber events. In many cases, these similarities are caused by the companies using the same technologies or third-party service providers, e.g., two large telecom companies in the U.S. may be more likely to use the same vendors than a large telecom company in the U.S. and a small professional services firm in France. Using the same vendor results in an exposure to the same cyber event trigger.
Using this framework to assess portfolio exposure helps insurers move from catastrophic, what-if thinking, to a more clear-cut assessment of realistic exposure. Carriers can run simulations based on cyber events affecting the top technologies and services per CRIMZON.
For example, technologies and third-party services related to hosting and email are often the same amongst companies within a specific zone. Any disruption in these areas can cause issues such as business interruption and data loss, which can lead to reputational damage, recovery costs, legal fees, etc. Insurers need to fully understand these types of exposures, and analyzing them in the context of CRIMZON can help them better understand how to de-risk their portfolios, set underwriting risk appetite limits, buy appropriate reinsurance/retro, improve their use of capital and provide more clarity to regulators.
Aggregating Policy Limits Using CRIMZON™
For carriers trying to understand portfolio exposures, using CRIMZON can help understand where to place policy limits. However, not every company fits neatly into specific CRIMZON.
Small and mid-size businesses typically fit easily into a zone based on the three dimensions of industry, geography and size. Yet a large enterprise might not be able to fit within clear classifications. Even if a big conglomerate operates entirely in one country, which is often not the case, it could easily operate across multiple industries. And even though the corporation itself is large, it could have subsidiaries of varying sizes. These ambiguities pose challenges for insurers deciding which CRIMZON to place large enterprises in.
That said, there are several approaches to labeling the exposure for analysis purposes. The first, most straightforward option is to decide which are the most important factors (e.g. choosing the primary country a conglomerate operates in) and placing the entire exposure in one CRIMZON.
A slightly more sophisticated approach is to take the largest components that an insurance carrier considers to be important, which might mean the exposure falls within two or three CRIMZON — a vast improvement over the dozens or even hundreds of others they might technically fall into. At the other end of the spectrum, there is a complete map of the large corporation and a granular description of how a loss can emerge and develop within that full map.
It is important to keep in mind the principles of materiality and proportionality when making decisions about aggregations: an insurance carrier with a portfolio specialized in SME business accepting incidental exposures to large companies may well choose a simple approach and place the entire risk from bigger corporations in one CRIMZON.
Another carrier, however, might underwrite a book where larger corporations are the majority; in this case it would be very important to be careful and distinguish each subsidiary individually, and maybe go as far as mapping some form of correlation between CRIMZON arising simply by the presence of constituent parts of different organizations across multiple zones.
For example, consider the following configuration, where three entities are spread across five different CRIMZON. Not one entity is present on all five, but there is one zone where all three are present. [Figures refer to fictional revenues.]
An insurance company with a well-spread portfolio, where these are the only three large enterprises, might want to place each entity in the CRIMZON attracting the largest revenue. Doing this would place each entity in a different zone. A more sophisticated carrier might decide to spread their exposure to each of these using just the top two CRIMZON by revenue, but doing this would ignore the obvious correlation in CRIMZON 3, which is where Entity 1 has the lowest revenue. There is no right answer, and sometimes it is appropriate to sensitivity test different approaches (if possible). The importance of accounting for the correlation in CRIMZON 3 depends on materiality and proportionality.
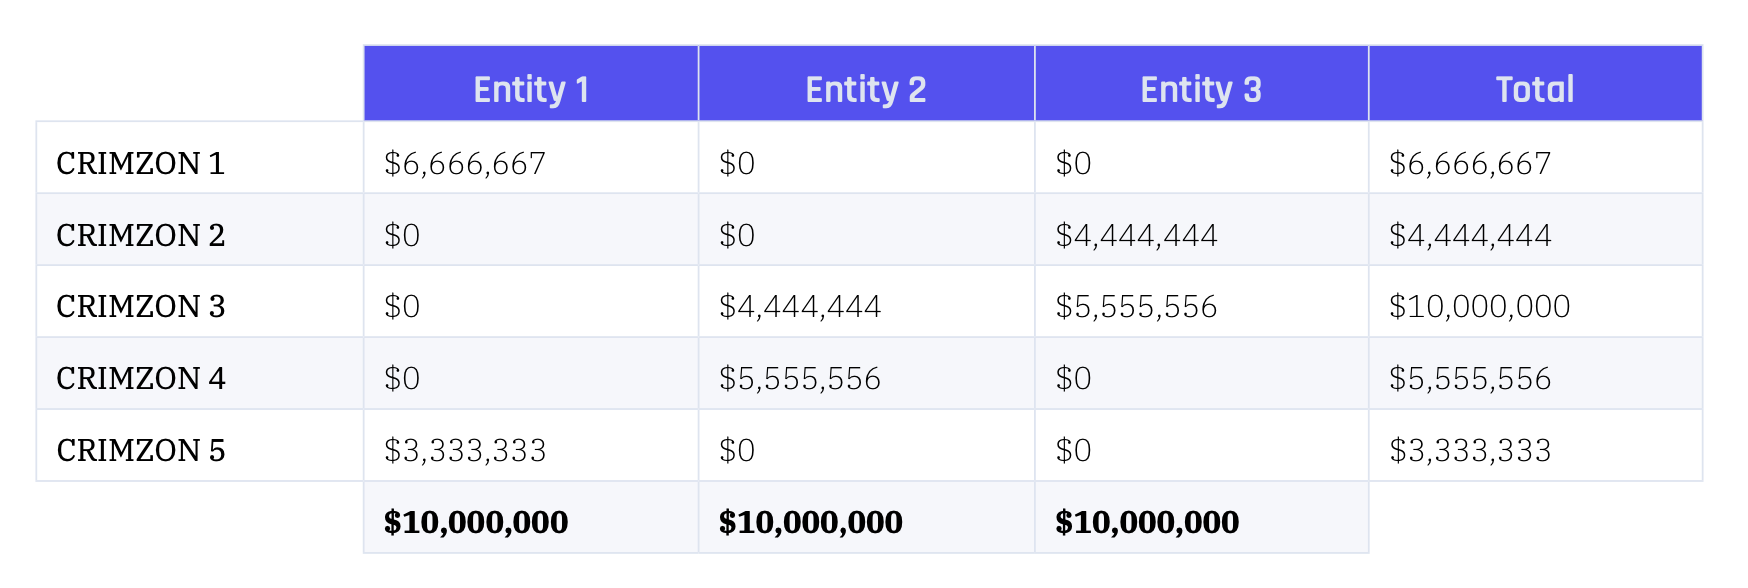
Suppose an insurance professional wants to assess the exposure arising from three $10 million policies, one for each of the entities in the example above. One possibility is to pick the CRIMZON that seems most relevant for each, as mentioned above. But when looking at the three entities as spanning across multiple zones, then there is more to it. Each entity can either have the limit duplicated by placing the $10 million in each zone, or the limit could be distributed. The latter can then take more and more complex forms, where the sum of the single contributions might or might not equal $10 million depending on how an organization assesses the risk in each individual zone.
Following the discussion above, consider three cases. Placing the $10 million in one zone for each entity provides a distribution of exposures that looks like $10 million in three different zones. Duplicating the limit across the top two zones by revenue shows an accumulation of $10 million in each zone except the third zone, where the accumulation is $20 million.
As seen below, distributing the limit according to revenues instead of duplicating provides a more nuanced picture, where the third zone remains the highest accumulation but others are similarly exposed.
All three methods are approximations, each with its pros and cons. Picking only one box per company, leaving others unaccounted for — even if the risk seems lower in these other zones — will in essence cause some exposure to be neglected. In the example above, for instance, the $10 million limit could be placed according to the correlation and thus on CRIMZON 3 for all entities, or according to revenues and thus in three different zones.
Distributing the limit across the CRIMZON could still cause some understatement, but it could be a good approach for insurance carriers with diverse portfolios. Duplicating limits would be the most conservative approach, but it creates an overstatement, since the full limit would not actually be paid out across each zone. That said, it could be a good approach for portfolios with conglomerates who account for only a small portion of the overall limit, as it creates some leeway.
Going a step further, it’s important to recognize that using sub-limits could help give a clearer picture of exposures, rather than just the full sum of policy limits. For example, a $10 million cyber policy may have a $5 million sub-limit for ransom. When accounting for ransomware risk across CRIMZON, it is therefore more appropriate to use the smaller sub-limit, rather than overstating the exposure.
Once the limits have been accounted for, the question of the probable maximum loss needs to be addressed. Cyber systemic events are not confined in space in the same way natural catastrophes are, and thus it would not be correct to assume the maximum accumulation by CRIMZON to be a good proxy for PML.
Using Impact-Based Modeling to Assess Exposure
After placing limits across CRIMZON, exposure managers and other risk professionals can use impact-based modeling to assess how cyber events and cyber catastrophes would specifically affect their portfolios. Impact-based modeling means focusing the modeling effort on the various impacts that a cyber event can have, either by defining accumulations strategies (e.g., looking at full limits assuming a ransomware attack) or developing a deterministic scenario.
Insurance practitioners have been using deterministic scenarios as a tool to manage exposures for a significant length of time. A deterministic scenario usually starts from an evolution of some sort of limit accumulation framework. For example, a simple way to look at Hurricane Katrina is to apply a percentage to the full limit exposure in New Orleans.
Stochastic models have not fully replaced nor have they removed the need for deterministic scenarios, mainly because it is much easier to understand and validate a deterministic computation but also because a stochastic catalog is in essence a collection of deterministic events. CRIMZON can be used to describe the footprint of real-life cyber events. As such, the framework presents itself rather naturally to support the definition of deterministic scenarios and from that the description of a full stochastic event set.
Defining Cyber Events and Cyber Datastrophes
Before assessing liability, it helps to clarify what might trigger a claim. Importantly, what a business defines as a cyber event or cyber catastrophe isn’t necessarily the same as how an insurer would classify these situations, as it depends on the language and coverage within a policy.
For Kovrr’s modeling methodology, a cyber event is defined using the CIA triad model of availability, confidentiality and integrity. If something affects data in one of these three ways, or has the fourth element of ransom (or potential for ransom), then that would be considered a cyber event.
When cyber events get taken to a more extreme level, then they could enter the realm of cyber catastrophes. Kovrr defines these catastrophes as:
- Being infrequent
- Causing severe loss, injury, or property damage across a large population of exposures
- Starting with a disruption to either a service provider or a technology
- Unfolding by replicating this disruption whenever possible
Modeling the Effects of Cyber Events and Catastrophes
As an insurance professional assesses what might be considered a cyber event or a catastrophe, they can begin to calculate how these different occurrences could affect exposure. Not all events would trigger the same losses, so it’s worthwhile to model multiple scenarios. One starting point could be assessing the losses associated with the lack of data availability, which then could trigger a business interruption element of some policies. And if that data was confidential and compromised, that could trigger another liability.
Getting an idea of these different impacts and their likelihood enables calculation of the probable maximum loss (PML) for a cyber event.
Getting a Full Grasp on Cyber PMLs
To fully understand cyber PMLs, it can help to consider what this modeling looks like in relation to property insurance.
Before catastrophe models existed, property insurers traditionally used CRESTA zones as a way to accumulate limits, similar to how cyber insurers can use CRIMZON. Yet in property, the CRESTA zones were designed in such a way as to assume that a natural catastrophe event would affect only one CRESTA. And if the event did affect multiple CRESTA, there would likely be a center.
For example, in an earthquake, the likelihood of damage, and therefore exposure, can be assumed to decrease alongside distance from the epicenter. If an examined area is within 50 kilometers of the epicenter, the PML might be estimated at, say, 20-30% of aggregate limits. But the further away from the center, the more the PML goes down.
However, in cyber, there is generally no center, and events typically affect multiple clusters (CRIMZON). Even in a situation where a cyberattack is self-propagating, there will typically be more than one instance of originating attack, as hackers try to find ways into multiple companies at once. The event will then go on from there and will not be limited by geography.
Yet no matter how viral the attack or how popular an affected service provider may be, an event will still only affect a finite number of CRIMZON, and not all companies within those zones will likely be affected. Eventually, attacks end, and with proper planning through the use of this framework, insurers can cap their risk by estimating ahead of time where they have the most exposure.
That’s why putting the same PML across an entire portfolio can be risky. Instead, insurers may be better off putting different PMLs on specific CRIMZON.
Determining PMLs Based on the Connectedness of CRIMZON™
Readers familiar with research by Kovrr on CRIMZON will remember the main focus being the hazard. Companies within the same CRIMZON tend to use similar technologies and service providers, which creates natural pockets of potential accumulations. However, there is another aspect of cyber risk that CRIMZON help to describe: the footprint of a cyber catastrophe.
Using the framework enables the description of the footprint of an event in terms of a list of CRIMZON, each associated with a local intensity describing how many entities were affected and what the average damage was. Kovrr published materials using this framework on two recent real-life examples: SolarWinds and Microsoft Exchange.
To assess PML risk across CRIMZON, arguably the most efficient and effective way is to first look at the limits assigned to key CRIMZON, ranking them from highest to lowest. That will then provide an idea of where the biggest concerns are in terms of maximum exposure. So modeling a 30% PML in a zone with the highest limit could represent more of a liability than a 50% PML in a lower-limit zone.
From there, it’s important to consider the interconnectedness of CRIMZON to fully understand a realistic PML across an entire portfolio. While attacks generally do not have a center and can easily spread to disparate geographies, there are certainly patterns within attacks.
Consider a portfolio spread across 1,000 CRIMZON with a total limit of $20 billion, so that, on average, each CRIMZON attracts a $20 million limit (setting aside the number of policies, attachment points and any considerations given by the presence of large enterprises spanning across multiple CRIMZON).
As shown by previous events, cyber catastrophes will spread following a pattern of infection along major communication channels across CRIMZON. In practical terms this means this hypothetical portfolio will most likely see a pattern of damage arising from scores of CRIMZON. The exact number can be a matter of debate, but common sense dictates there will be at least some agreement on a range, most likely informed by some form of modeling. Kovrr’s cyber catastrophe model, for instance, can help stakeholders in this respect. For example, suppose this hypothetical portfolio will most likely see a catastrophe unfolding across 100 CRIMZON. But which zones should be selected?
Practitioners are often tempted to answer that last question in terms of absolute hazard, therefore looking for those CRIMZON which are most likely to generate a loss. While this approach has its merits, it could be a daunting task and effectively require a lot more energy and resources than materiality and proportionality would allow. Best practices suggest to look for exposures first, thus summing all the limits by CRIMZON and ranking the list of zones by limit exposed in descending order. The top 100 selected in this way will provide a good place to start even if less directly related to a hazard.
Once the CRIMZON have been selected, the next step is to define a PML in each of them. This is usually defined as a percentage to apply to the total limit, but it could be slightly more sophisticated and be defined, for instance, as a percentage to be applied to the sum of limit and attachment point (for excess business) or to a pre-defined estimated maximum loss. For simplicity’s sake, the discussion here will be kept to a PML in the sense of a percentage to be applied to the sum of all limits.
When defining PMLs, some basic relativities are obvious. For instance, medical records are more likely to attract bigger liabilities than retail customer records. Other relativities will arise from specific portfolio considerations, but even in the absence of any information or opinion about possible severity, it is realistic to assume the level of damage will not exceed a predefined maximum percentage, with the maximum depending once again on the shape of the portfolio.
For instance, the sum of all exposures across the 100 zones isolated so far will almost certainly amount to more than 10% of all the exposure. However, this can be because the majority of the policies are in these zones, or because all the biggest limits exist in these zones. In the former case a lower percentage can be applied, because the number of businesses suffering a loss in each zone is likely to be low, but in the latter case, with fewer policies and higher limits, a higher percentage is more appropriate.
Looking at the average case, when the total is exactly 10% of the exposures, which suggests a very well balanced portfolio, a PML of 50% across all 100 zones would generate a loss of $1 billion, for which the hypothetical portfolio looks reasonably conservative.
Using Modeling Insights for Portfolio Optimization
The CRIMZON framework allows exposure managers to make sense of cyber risk, regardless of the size and complexity of the portfolio analysed. It can be a very powerful tool for those portfolios where cyber is not very material, requiring only a few data points per insured and only superficial knowledge of the hazard. But where materiality is a factor the CRIMZON framework allows for increasing levels of sophistication, from more complex aggregate accumulations to deterministic scenarios to stochastic models.
Ultimately carriers need to determine how much capital to allocate to cyber and steer their underwriting practices so that capital is deployed efficiently. The simplest example of capital allocation is aggregation of exposures, and the simplest example of portfolio optimization is setting aggregate caps by CRIMZON.
Carriers can take clear actions to optimise the composition of their portfolio. For example, once a specific CRIMZON is identified as attracting too much risk in comparison to others, there are two possible ways to remedy: underwrite more in other zones to balance the risk, or reduce the exposure in that particular zone by making policy renewals less attractive.
For natural hazards, where geography plays an important role in shaping the possible loss events, it is easy to understand the diversification effect of having a balanced set of exposures across different accumulation zones. It is intuitively not possible to lose all the policy limits in the book at once, save for such extreme scenarios like a meteorite strike. Some practitioners however have been wondering in the past whether cyber could be the exception, noting how events seemed to have no boundaries. Using the CRIMZON framework it becomes again intuitive to understand the diversification effect, noting how big events have affected in the past a large but limited number of zones and only in a few of these (if any) a large number of businesses.
Event reports by Kovrr on SolarWinds and Microsoft Exchange have demonstrated how carriers can use the CRIMZON framework not only in a generic accumulation scenario, but also to respond to real world events. This in turn can give confidence around building deterministic events using the framework, and eventually a full stochastic catalog based on the same approach.
Exposure managers can then take advantage of this newfound confidence to validate cyber models using their own intuition, and in turn build systems and processes around a view of risk they truly own. Adopting the CRIMZON framework can therefore lead to better conversations with regulators, shifting the focus from hypothetical reoccurrences of past events (like the NotPetya as if) to realistic potential losses threatening a portfolio here and now. The benefit of such a shift can include everything from a lower regulatory burden all the way to a lower capital load.
Another potential benefit is determining reinsurance needs and negotiating terms with reinsurers, not only because a better understanding of the risk leads to a better estimate of the downside, but also because more clarity on how losses are expected to unfold may well lead to a higher level of contract certainty. Reinsurers using the framework might be willing to provide capacity for specific CRIMZON or exclude specific others.
Altogether, using CRIMZON provides a more accurate picture of an insurer’s true exposure, not only for the internal benefit of knowing this information but also in terms of potentially cutting expenses and growing revenue.


.jpg)
.jpg)
