Cyber Risk Quantification. Minimal Inputs. Maximum Insights.
Built on one of the largest cyber insurance loss datasets in the industry, Top-Down Scenarios generate a complete financial picture of an entity's cyber exposure with minimal inputs. The platform models dozens of scenarios out of the box, from ransomware via phishing and data breaches through credential theft to business interruption caused by third-party outages, each tied to real-world insurance coverage categories. Every output, from average annual loss (AAL) to event likelihood, is benchmarked against industry peers for immediate, actionable context.
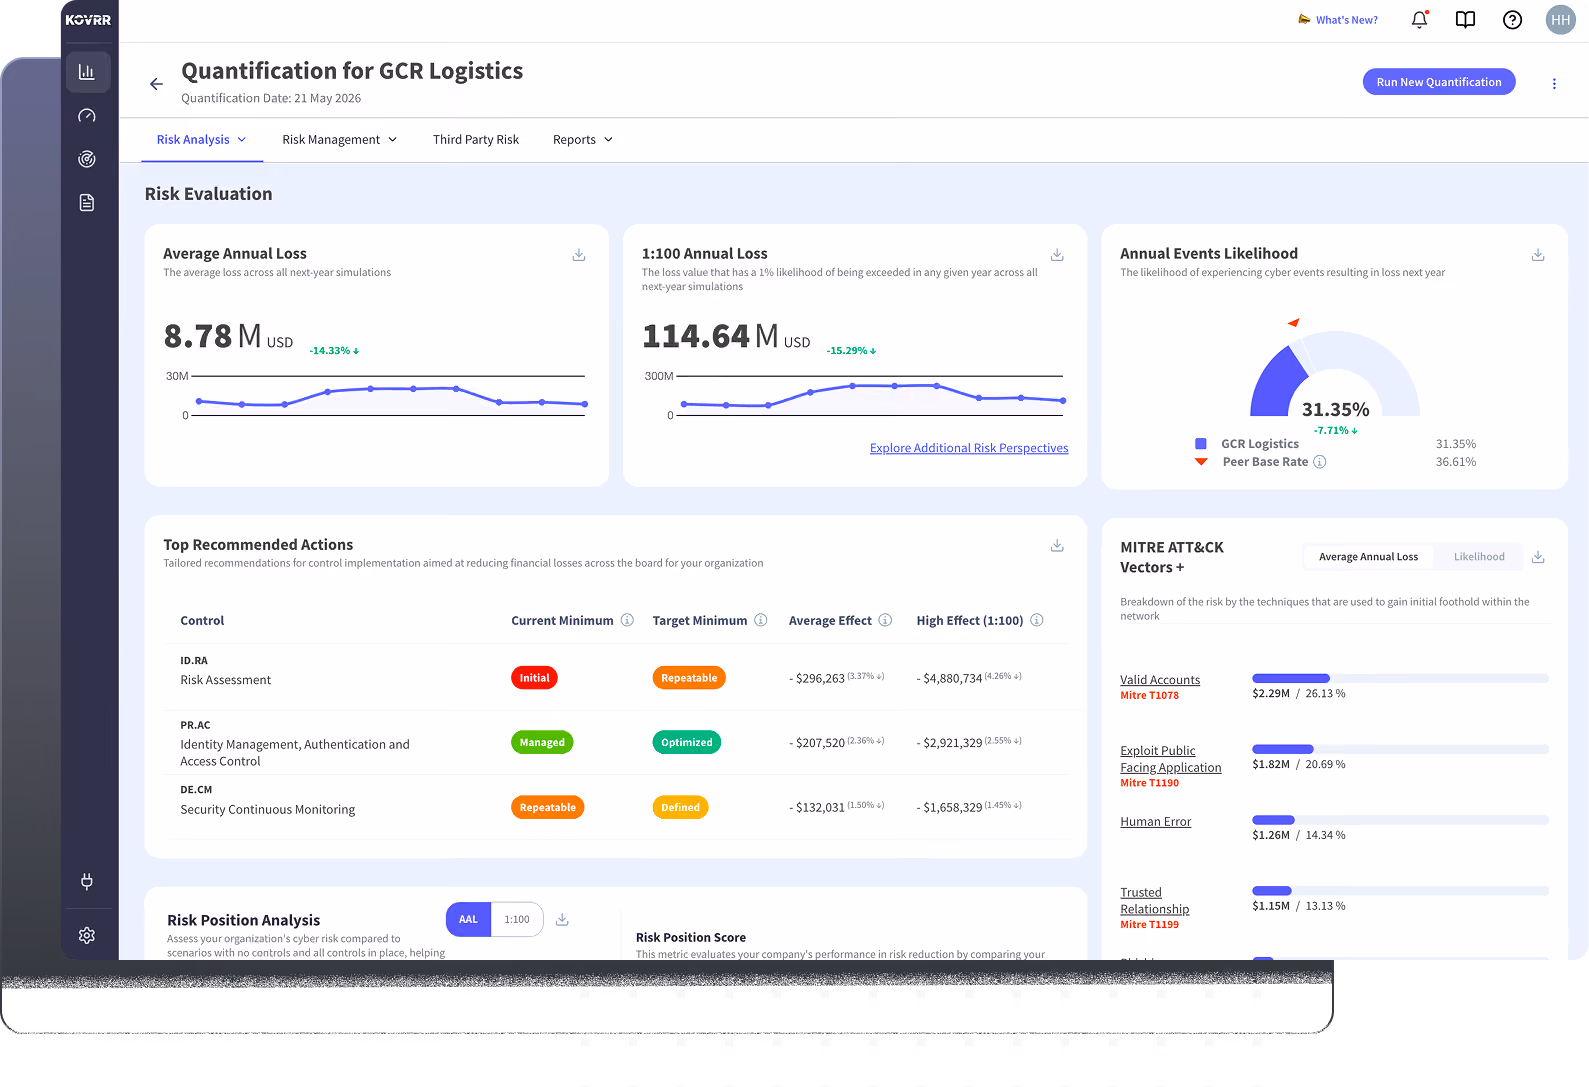
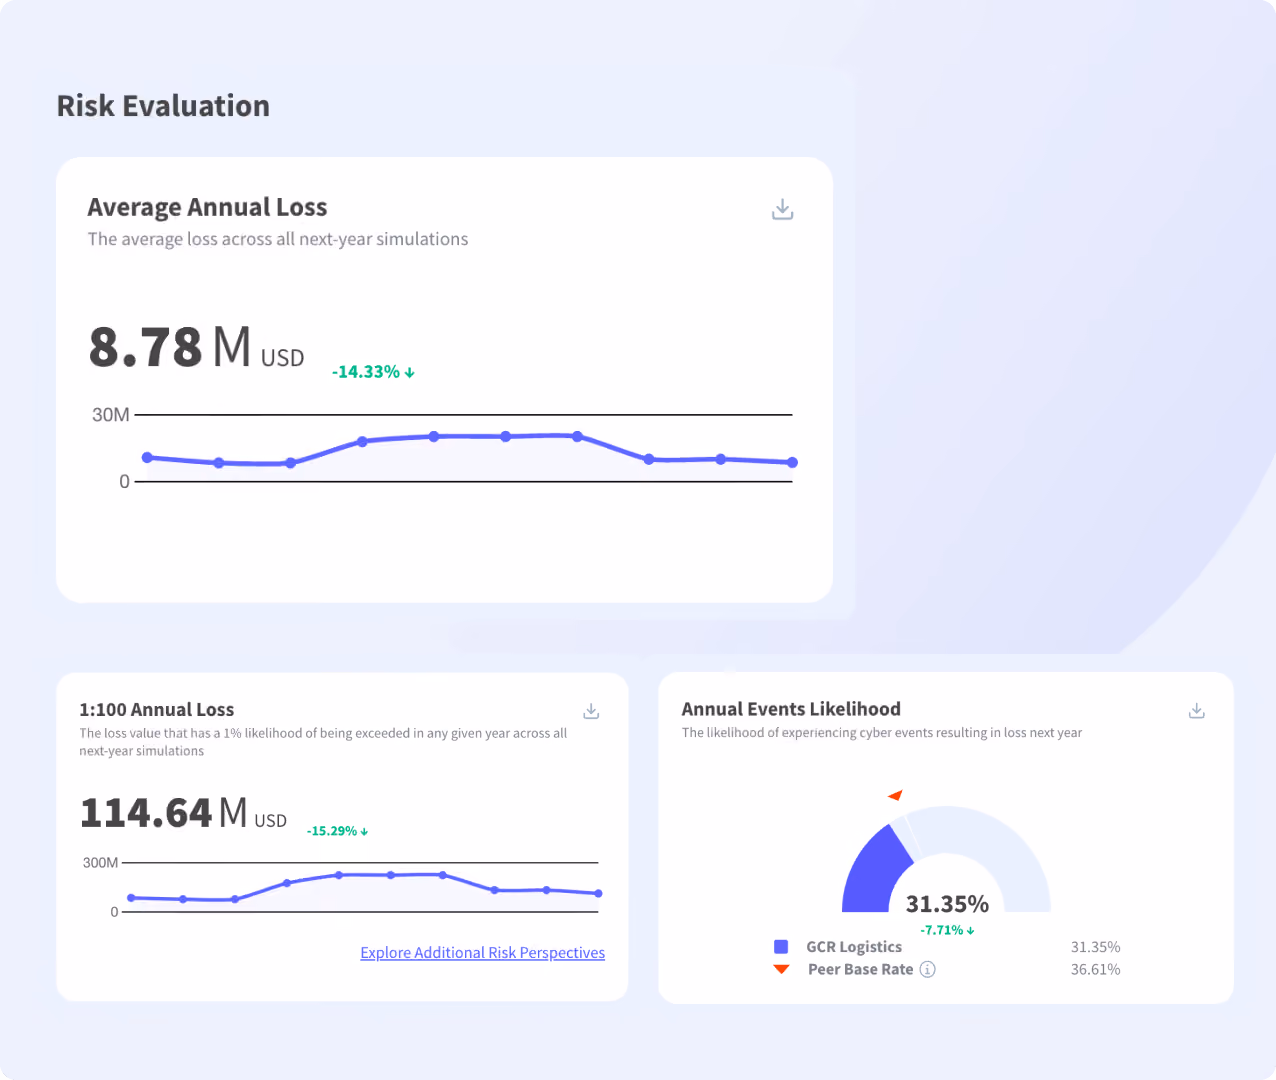
Financial Metrics That Put Cyber Risk in Context
Top-Down Scenarios run tens of thousands of Monte Carlo simulations that factor in industry, revenue, technology stack, and security posture to produce a full model of an entity's cyber exposure. From that simulation, the platform surfaces a diverse set of insights and metrics, including, among others, average annual loss, 1:100 tail risk, and annual event likelihood, each benchmarked against peers operating in the same space. No surveys, no subjective scoring, no manual risk assessments.
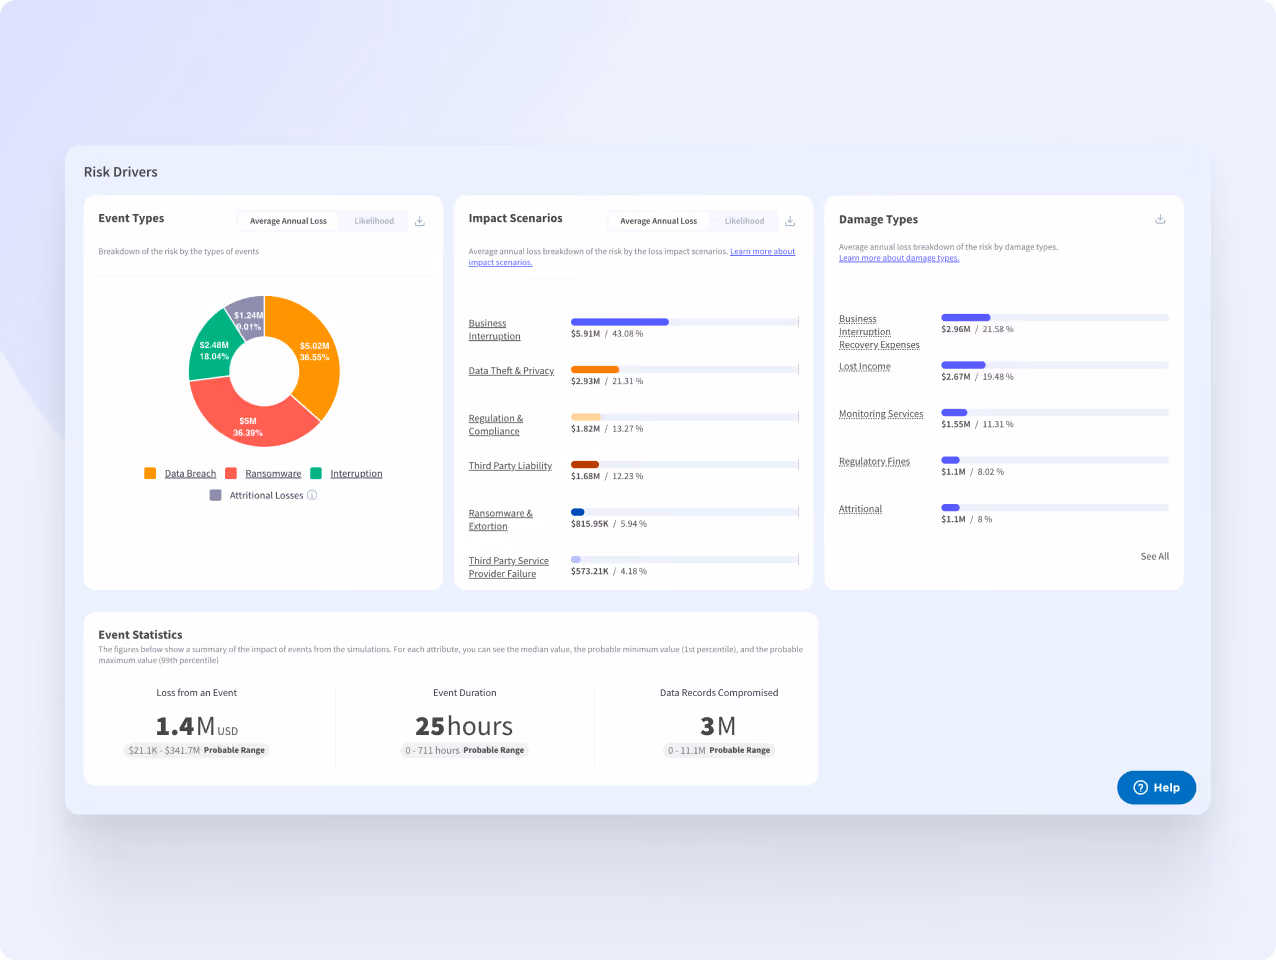
What's Driving the Financial Exposure
Every loss figure can be traced back to specific risk drivers. The platform breaks down exposure across event types like data breach, ransomware, and business interruption, then goes further into impact scenarios and damage types. Kovrr is the only solution that provides a full export of the underlying simulation data, enabling risk managers to examine each simulated event independently rather than relying solely on what the dashboard presents.
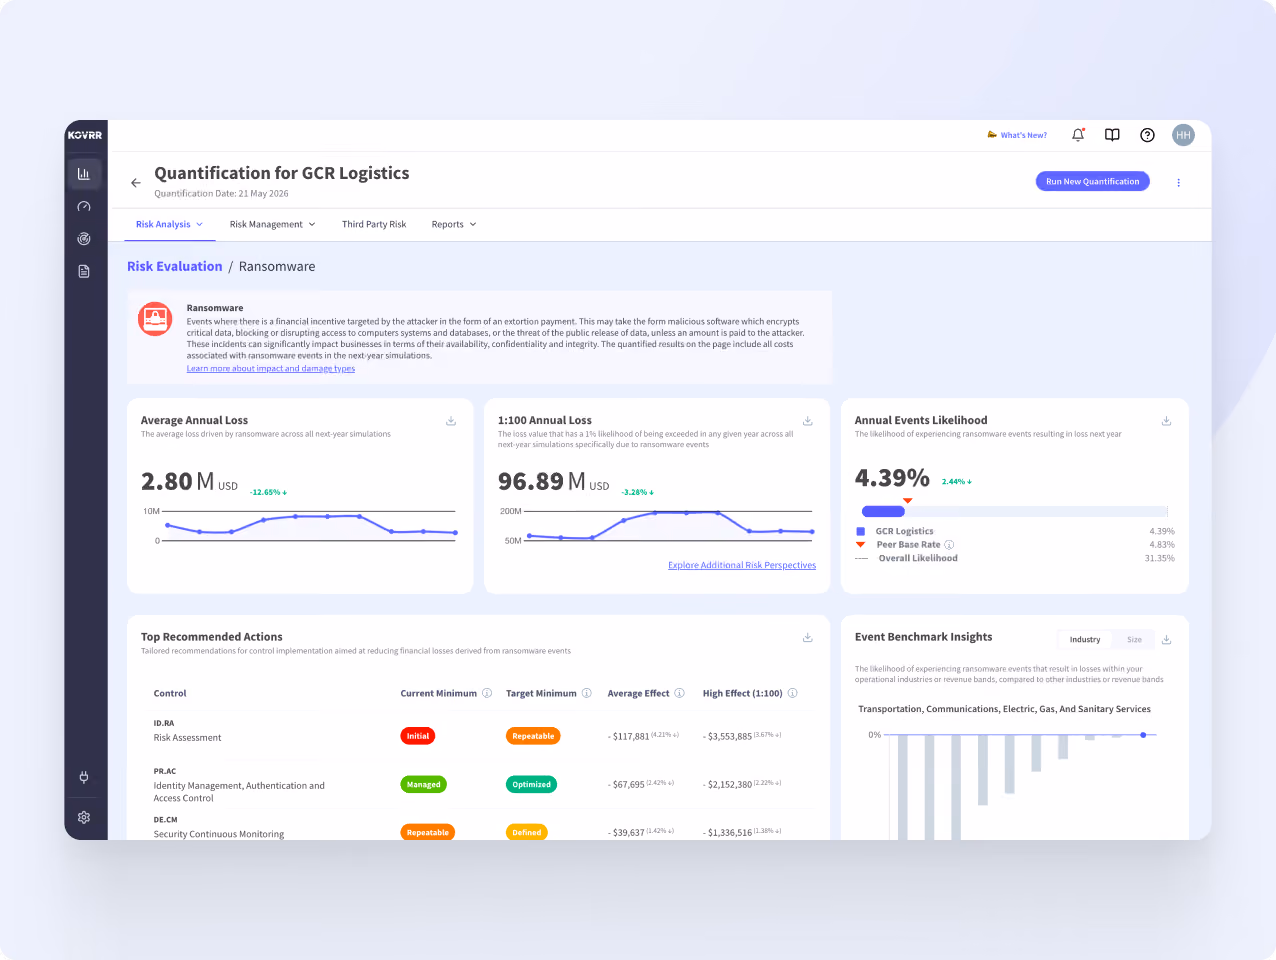
Explore Any Event Type or Attack Vector in Full Detail
Select any event type or MITRE ATT&CK vector, and the platform opens a dedicated view scoped entirely to that one threat. Average annual loss, tail risk, likelihood, peer benchmarking, and recommended control upgrades all regenerate for the selected scenario. The same analytical depth that exists at the entity level applies here, focused on a single risk.


Reporting These Cyber Metrics to the Board?
Any visual or metric in the platform can be downloaded for custom use, and Kovrr's Reports Hub offers a diverse set of board-ready reports designed for stakeholders setting risk appetite and planning budgets.

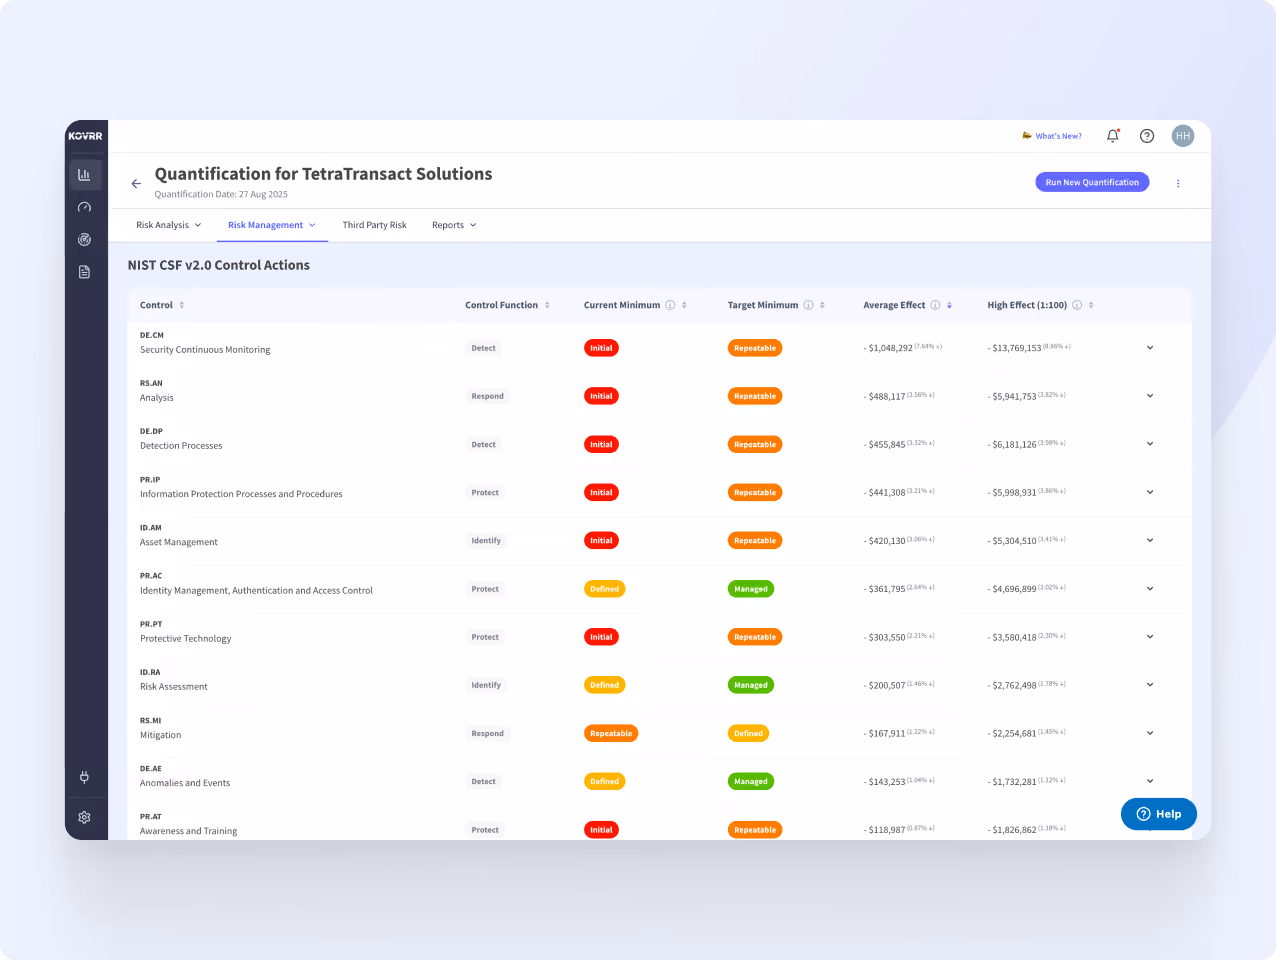
Financial Impact of Every Security Control Upgrade or Failure
The platform maps each entity's security posture and ranks every control by the financial impact of improving it or having it fail. Each recommendation includes the expected reduction in loss at both the average and 1:100 tail. Controls can also be broken down by asset group, so risk managers can see where a specific upgrade would move the needle most across regions, infrastructure, cloud environments, and endpoints.
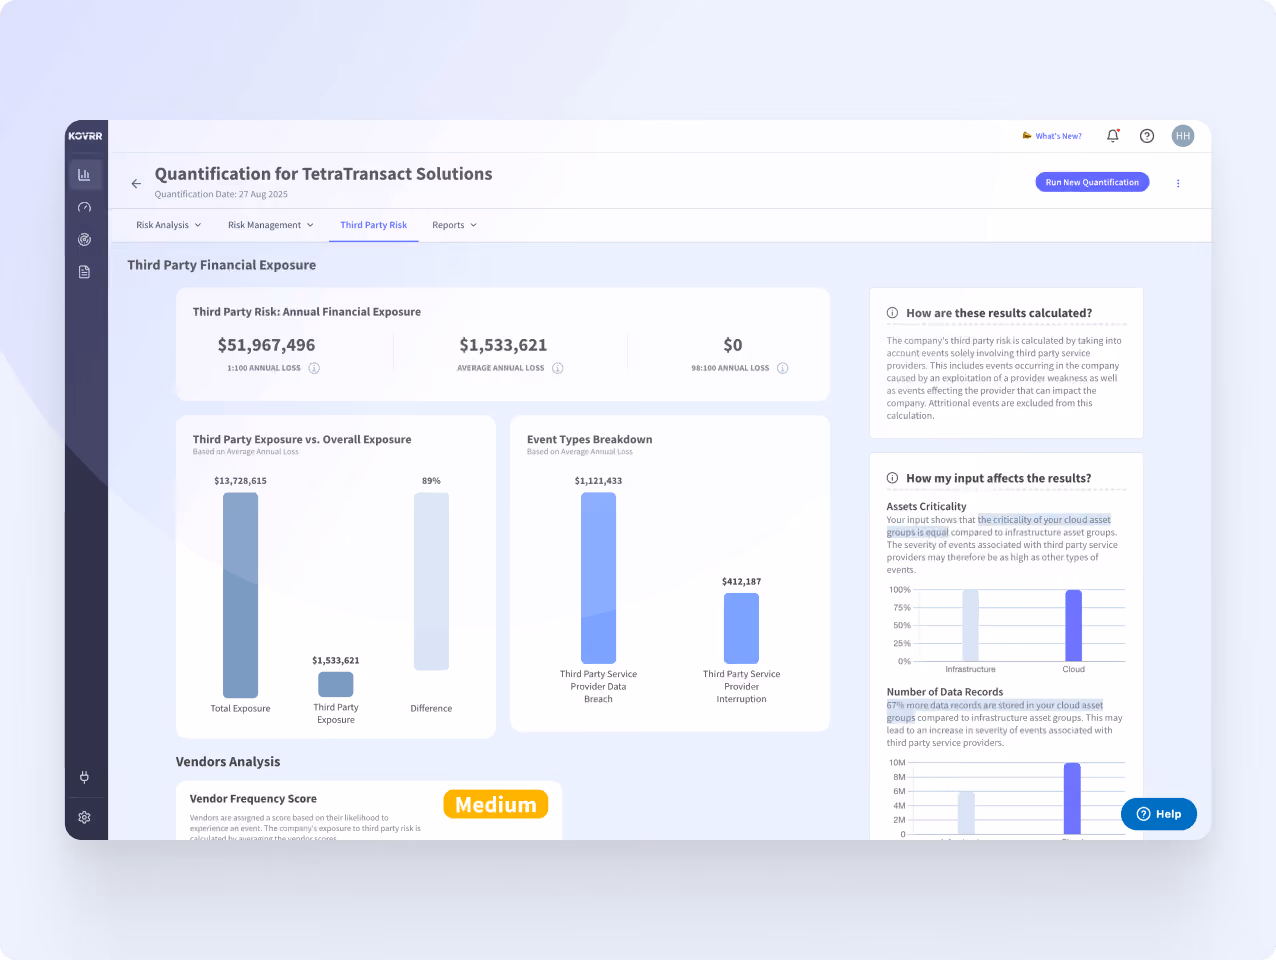
Measuring Third-Party-Driven Risk Exposure
The model uses an entity's mapped technology stack to identify which third-party service providers are part of the environment and then quantifies their contribution to overall financial exposure. The platform then breaks down third-party-driven loss by event type and compares it against total exposure so risk managers can see exactly how much of the risk sits with external providers.
Track How Cyber Exposure Changes Over Time
Every quantification run is logged with a full changelog showing what triggered the movement, whether it was a model update, a change to the security profile, or an adjustment to the entity's technology stack. Risk managers can compare results across runs, configure alerts through the Notification Center to stay informed as changes occur, and see exactly how average annual loss, tail risk, and risk position score have responded over time.
Top-Down Scenarios FAQs
Quantify My Cyber ExposureWhat data is used to generate Top-Down Scenarios?

How are Top-Down Scenarios different from Bottom-Up Scenarios?
Can I drill down into specific event types or attack vectors?
How often are Top-Down Scenarios updated?
What security frameworks do the control recommendations map to?
