Model the ROI of Cyber Risk Decisions Before Implementation
The Decision Simulator equips security and GRC teams to create and manage multiple decision scenarios in parallel. Each simulation models how a specific action would affect financial exposure, comparing baseline risk against projected outcomes and calculating return on security investment. Whether the decision involves improving control maturity, introducing a new security capability, or adopting a compliance framework, the results help teams prioritize where to allocate resources for the greatest risk reduction.
Multiple Decision Types, One Consistent Framework
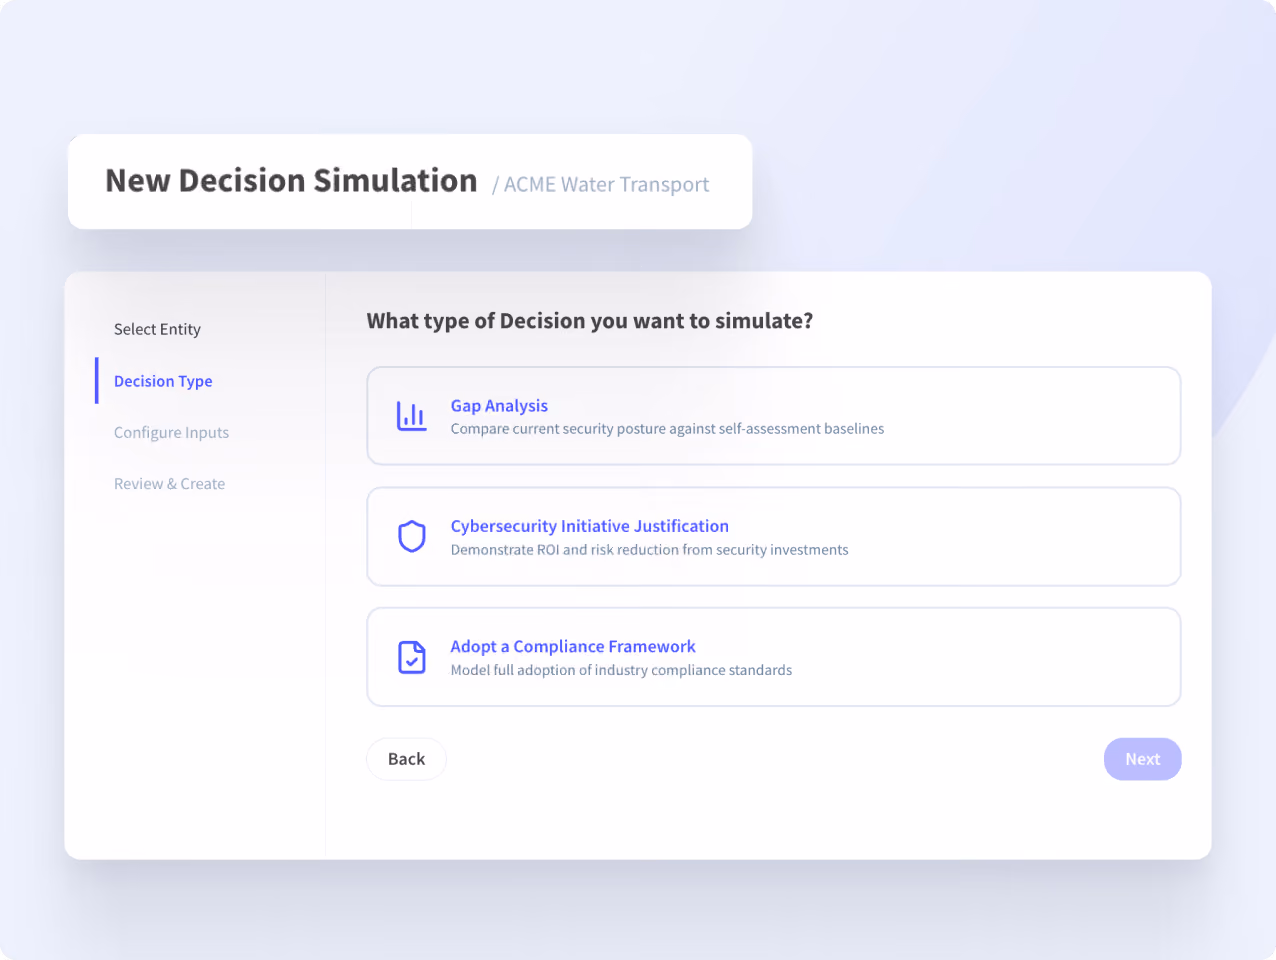
The Decision Simulator supports several simulation types, including gap analysis, cybersecurity initiative justification, compliance framework adoption, and custom scenarios. Each one follows a structured configuration path tailored to the decision being evaluated, but all produce the same standardized output. Different types of decisions can be compared and prioritized according to risk reduction and projected ROI, using a consistent methodology.
Simulations Built on Existing Assessment Data
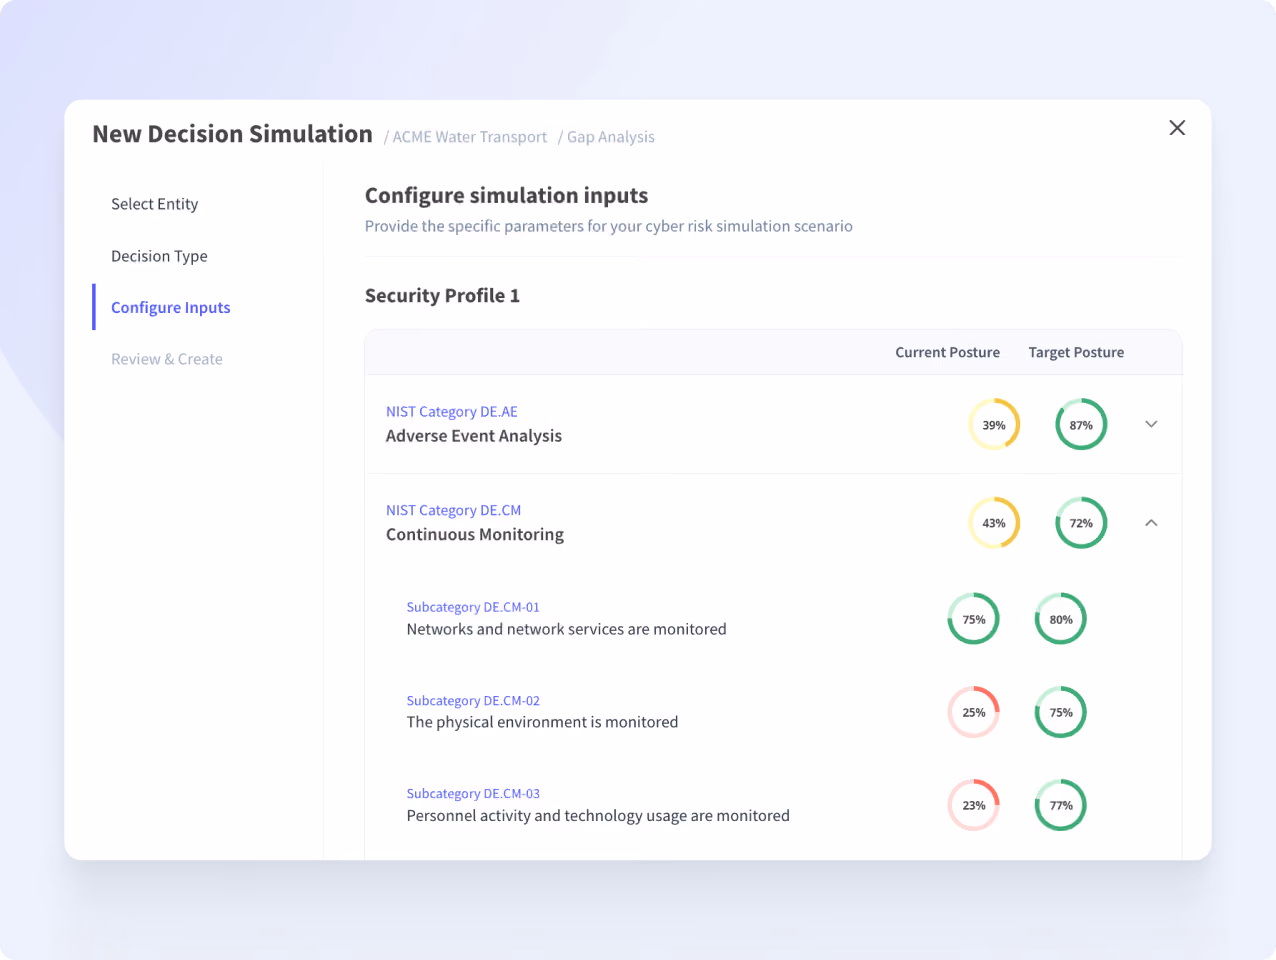
Current control maturity levels are auto-populated from assessment data within the platform, whether sourced through continuous control monitoring (CCM), direct API connections to internal controls, or existing self-assessments. Every simulation starts from an accurate baseline without manual data entry. Teams define target states at the control and safeguard level, and simulations can be scoped to specific asset groups or business units to reflect how improvements affect different parts of the environment.


The Full Decision Simulation Workflow, Explained
Learn how the Decision Simulator models control improvements, security investments, and compliance efforts, and translates each one into quantified risk reduction and return on investment.

Baseline Exposure Versus Simulated Outcomes
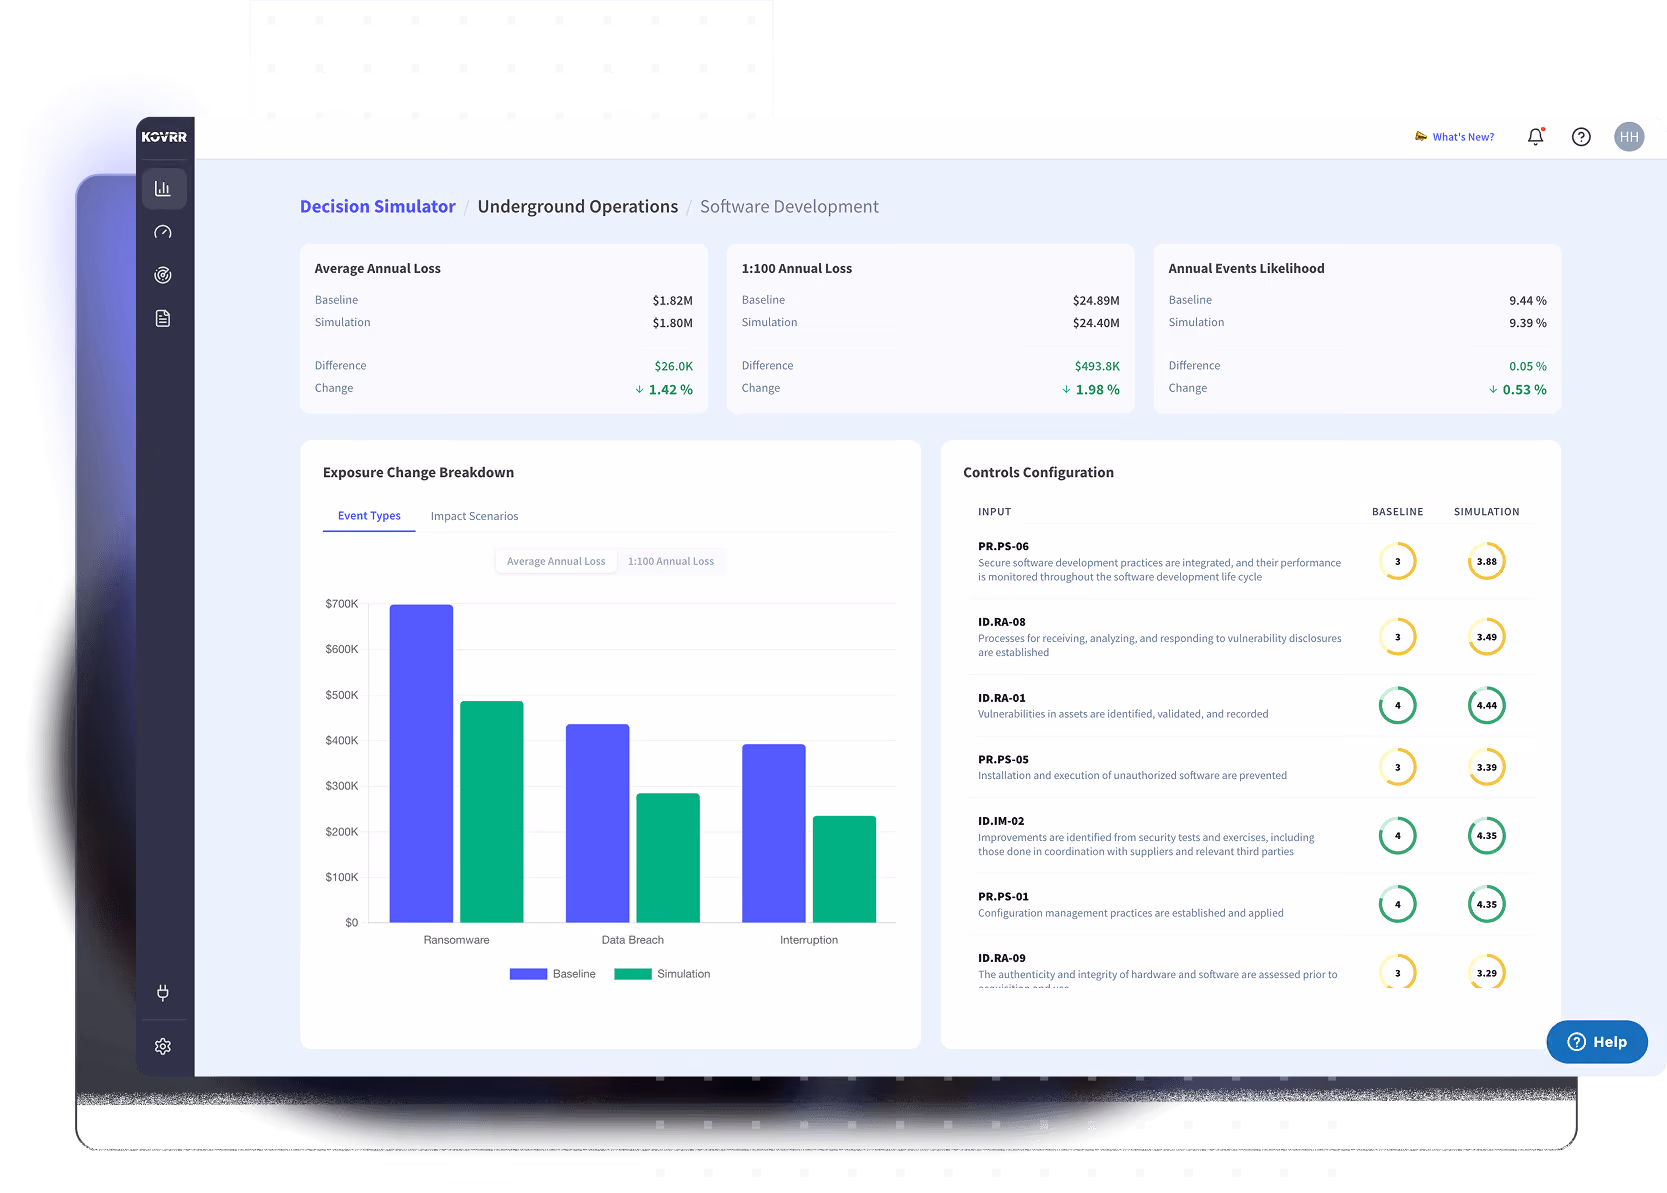
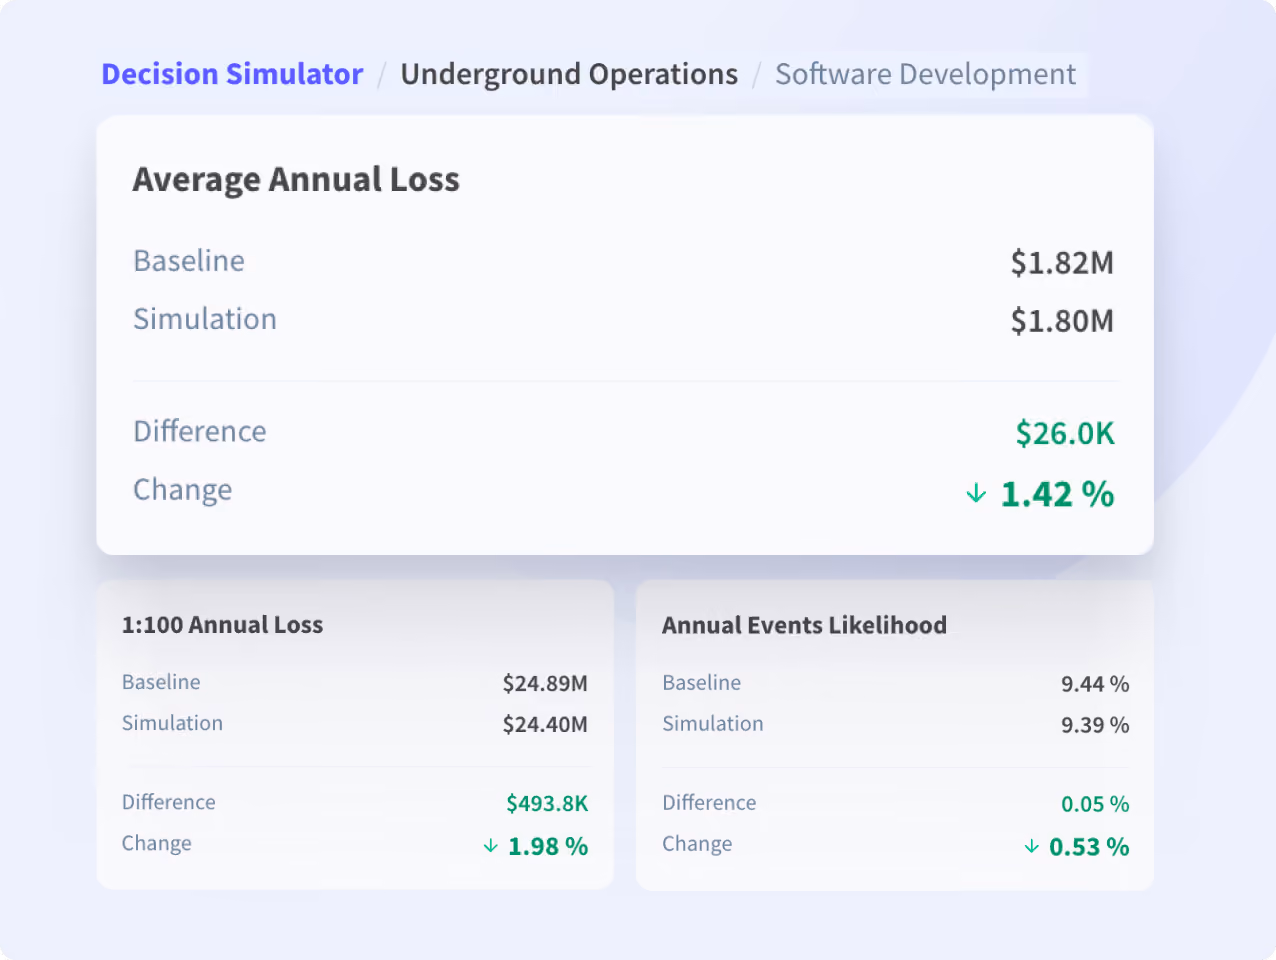
Once a simulation runs, the platform compares baseline exposure against projected outcomes across average annual loss, 1:100 tail risk, and annual events likelihood. The difference and percentage change are displayed for each metric. Teams can see exactly how much a modeled decision would reduce financial exposure before allocating budget or resources to implementation.
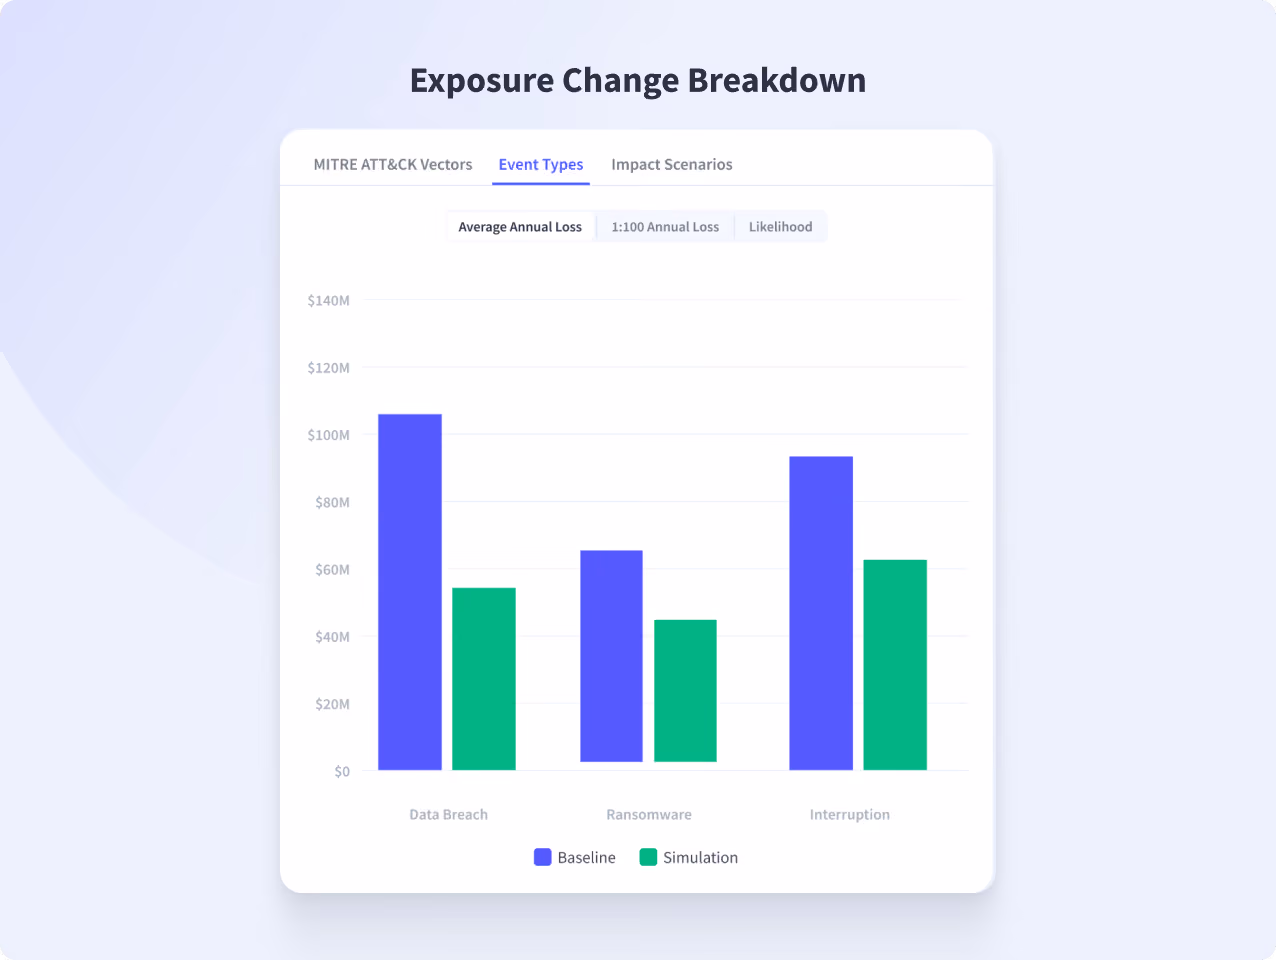
Discover Where Exposure Changes to Optimize Spending
The Exposure Change Breakdown segments loss by event type, MITRE ATT&CK vectors, and impact scenarios. Baseline and simulated values are displayed side by side, so teams can pinpoint which areas of risk respond most to the modeled decision and which remain unchanged. That granularity helps teams prioritize initiatives and direct resources where they will have the greatest impact.
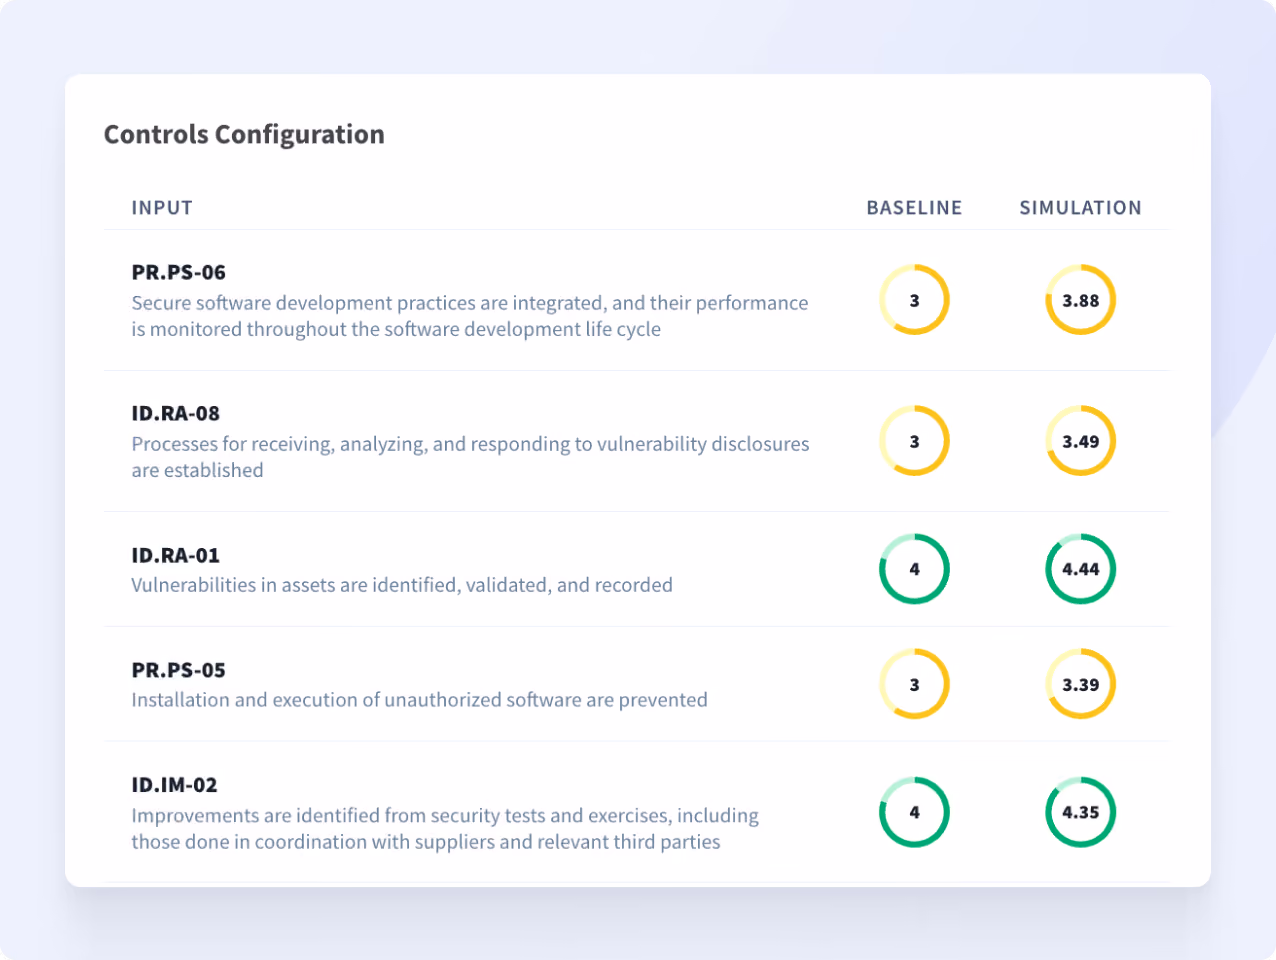
Trace Cyber Risk Reduction to Specific Control Changes
The Controls Configuration view shows baseline and simulated maturity levels for every control involved in the simulation. Each improvement is tied to a specific asset group, so teams can see which adjustments are driving the projected risk reduction and whether the associated investment is justified. The connection between control-level changes and financial outcomes is preserved throughout the entire simulation.
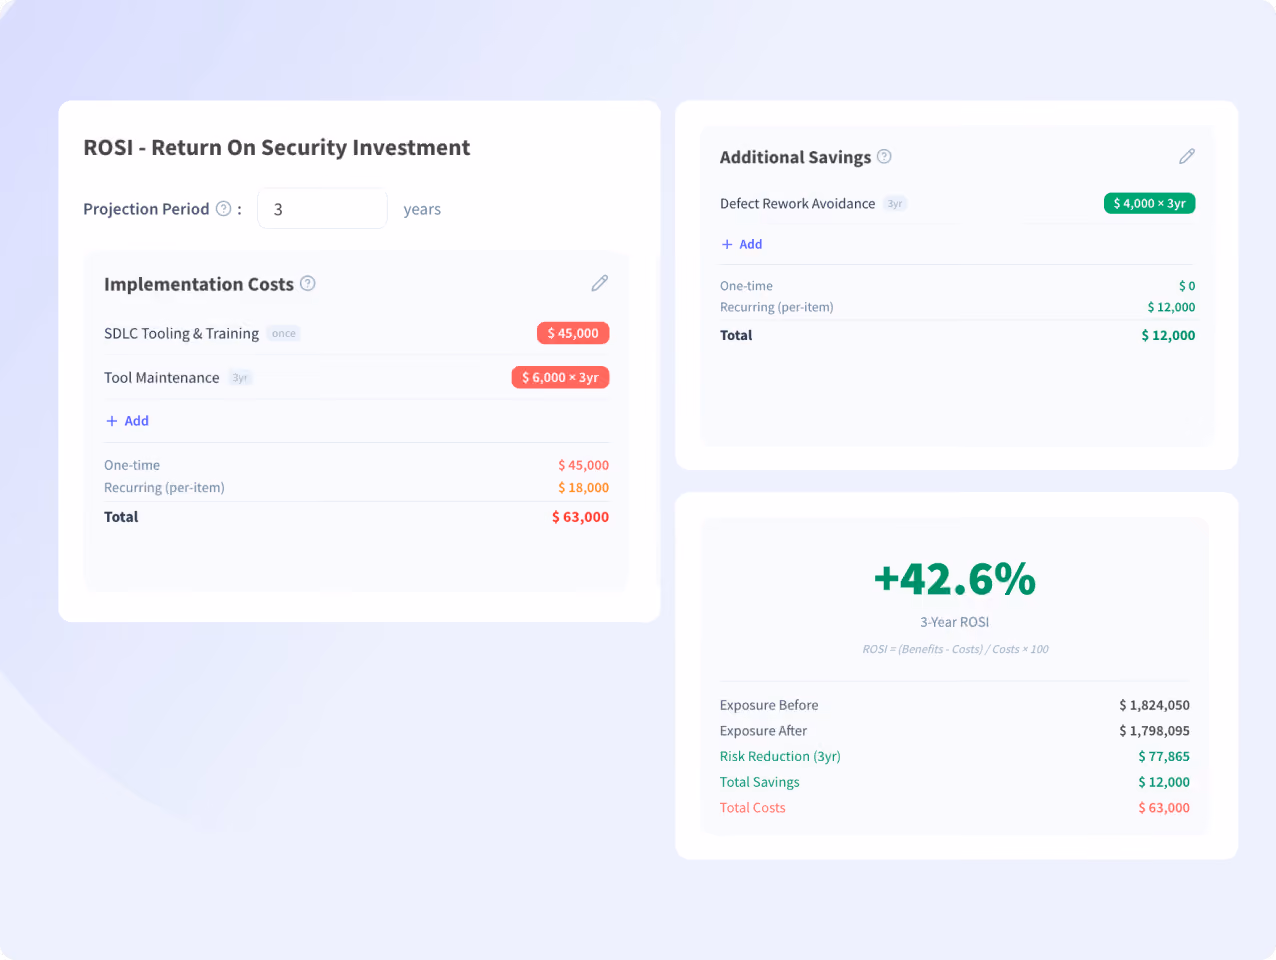
Calculate Return on Security Investment (ROSI) for Every Decision
The ROSI view layers implementation costs on top of quantified risk reduction. Labor, ongoing management, enablement, and additional savings like efficiency gains and insurance premium reductions are all factored in. The output is an overall return percentage calculated over a defined time horizon, giving teams the same level of financial rigor they would apply to any other business investment.
Decision Simulator FAQs
Simulate My Next Cyber Risk DecisionWhat is a cyber risk decision simulator?

How can I calculate the ROI of a cybersecurity investment?
How does compliance with a cybersecurity framework affect risk exposure?
How can security teams justify cybersecurity spending to the board?
What is the difference between a gap analysis and a cybersecurity initiative justification?
