.png)
Blog Post
Assembling Quantified Cyber Risk Metrics Into a Report That Lands
September 14, 2026
TL;DR
- Cyber risk quantification (CRQ) produces powerful numbers, but a single figure rarely moves a decision on its own. What convinces a decision-maker is the right set of figures assembled for the person reading them and the choice in front of them.
- The Reports Hub launched with ready-made reports built around common use cases. Custom Reports extends that with a builder where anyone composes a report block by block, tailored to the exact conversation.
- Reports start from role-based templates covering the CEO, CFO, CISO, and other leaders, then bend to fit through a library of metrics spanning exposure, likelihood, scenarios, controls, and insurance.
- The same quantification can produce entirely different reports. A board sees financial exposure while a CISO sees control performance, drawn from one identical model.
- The discipline reaches past cyber. Kovrr applies the same quantification and visibility approach to AI security and governance, where leaders face major decisions with limited evidence.
A Number Alone Rarely Convinces Anyone
Cyber risk quantification (CRQ) produces a lot of numbers, from average annual loss and tail exposure through to event likelihoods and loss broken down by attack vector. Each figure carries value on its own, yet a number sitting in isolation rarely convinces anyone to act. What convinces a decision-maker is a set of figures assembled in the right order, framed for the person reading them, and pointed squarely at the choice in front of them.
That assembly is the real work. A board weighing next year's cyber budget needs a different composition than a CISO defending a specific control upgrade, and it needs something different again from what an underwriter requires when pricing a policy against modeled exposure. The underlying quantification stays identical across all three cases. What changes is which figures come forward, how they sit together on the page, and what question they set out to answer.
Ready-Made and Made to Measure: Reports for Any Occasion
When Kovrr introduced the Reports Hub, it brought a library of ready-made reports built around the questions leaders ask most often. A board summary spoke to overall exposure. A materiality analysis anchored disclosure conversations. A portfolio view consolidated risk across business units. Each report took the same quantified intelligence and organized it into the context a particular discussion called for, so the right figures reached the right people without manual reshaping every time.
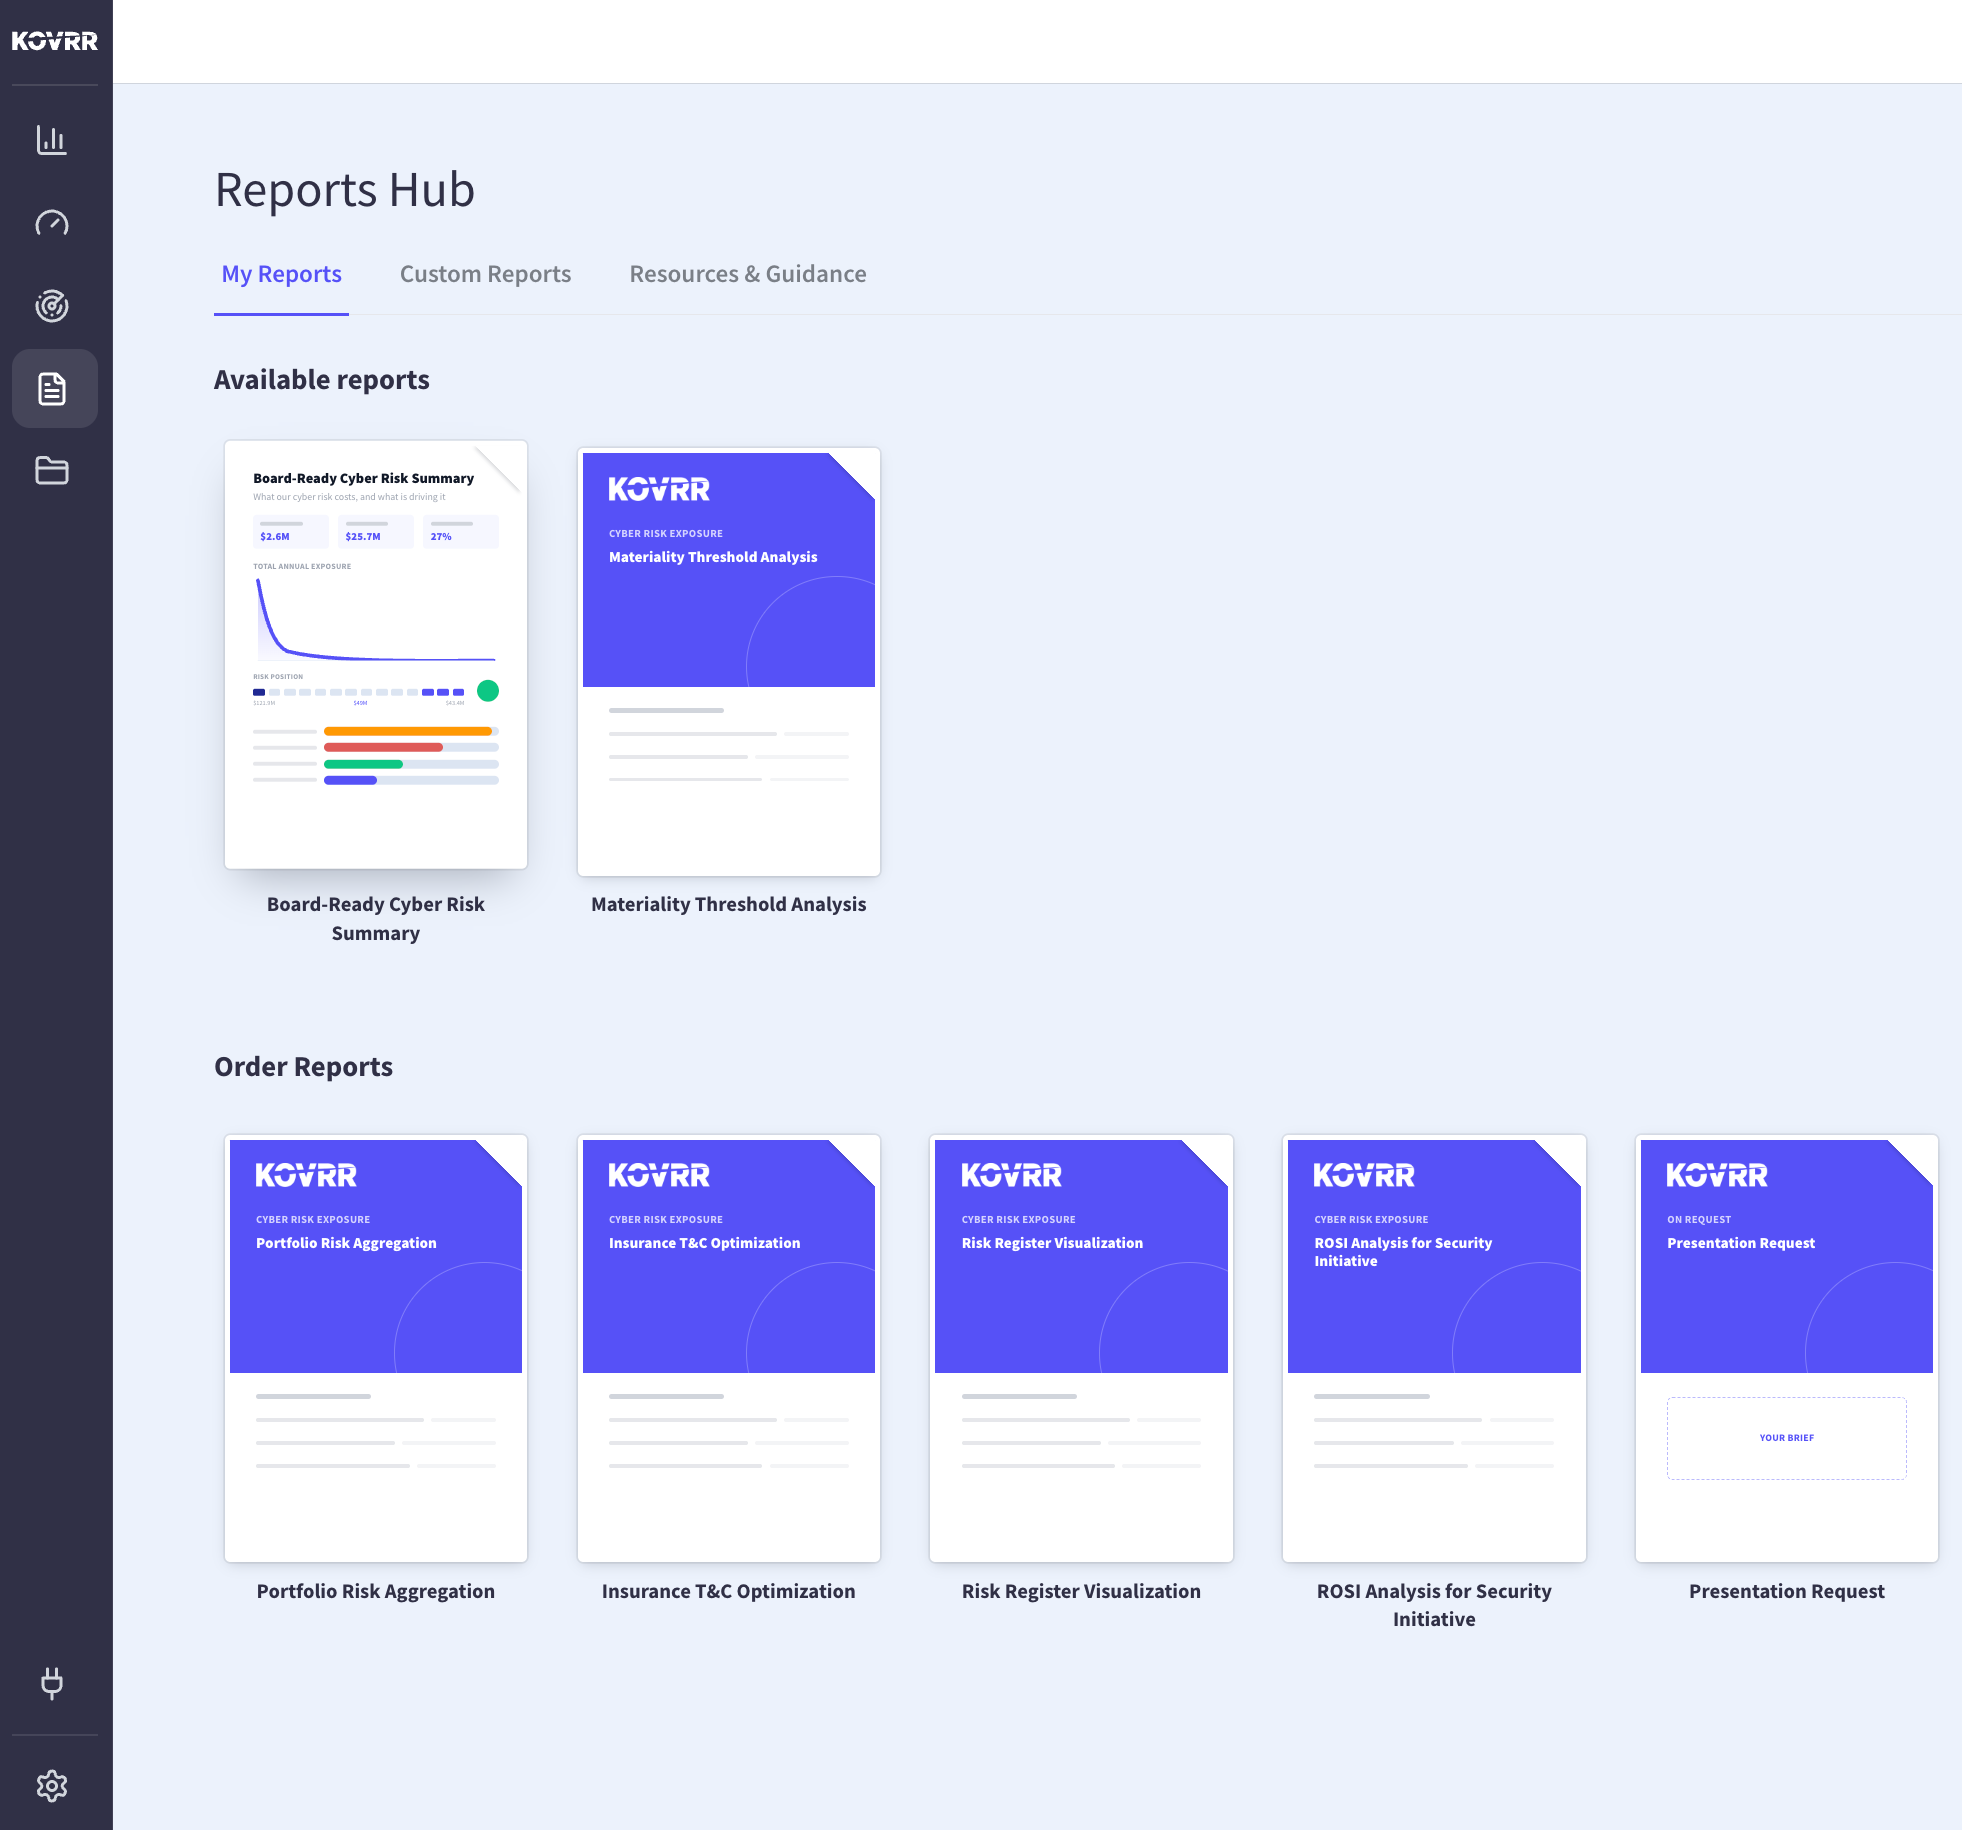
That library still does its job, and for most recurring conversations it remains the fastest route to a finished report. Some discussions, though, call for a tailored fit. A leader might want one specific combination of metrics for one specific audience on a given day, matched exactly to the question on the table. Custom Reports makes that straightforward, letting anyone tailor the exact composition a moment calls for without waiting on a new template or a manual rebuild.
The Builder Behind Every Custom Report
Custom Reports works from a canvas. A user picks the entity and the quantification, then draws from a library of report blocks that map to every part of the model, including headline metrics, exposure breakdowns, likelihood by driver, loss curves, risk register scenarios, control maturity, and insurance views. Each block drops onto the page, resizes to fit, and pulls live figures from the selected quantification, so the report reflects real modeled output rather than a static mockup.
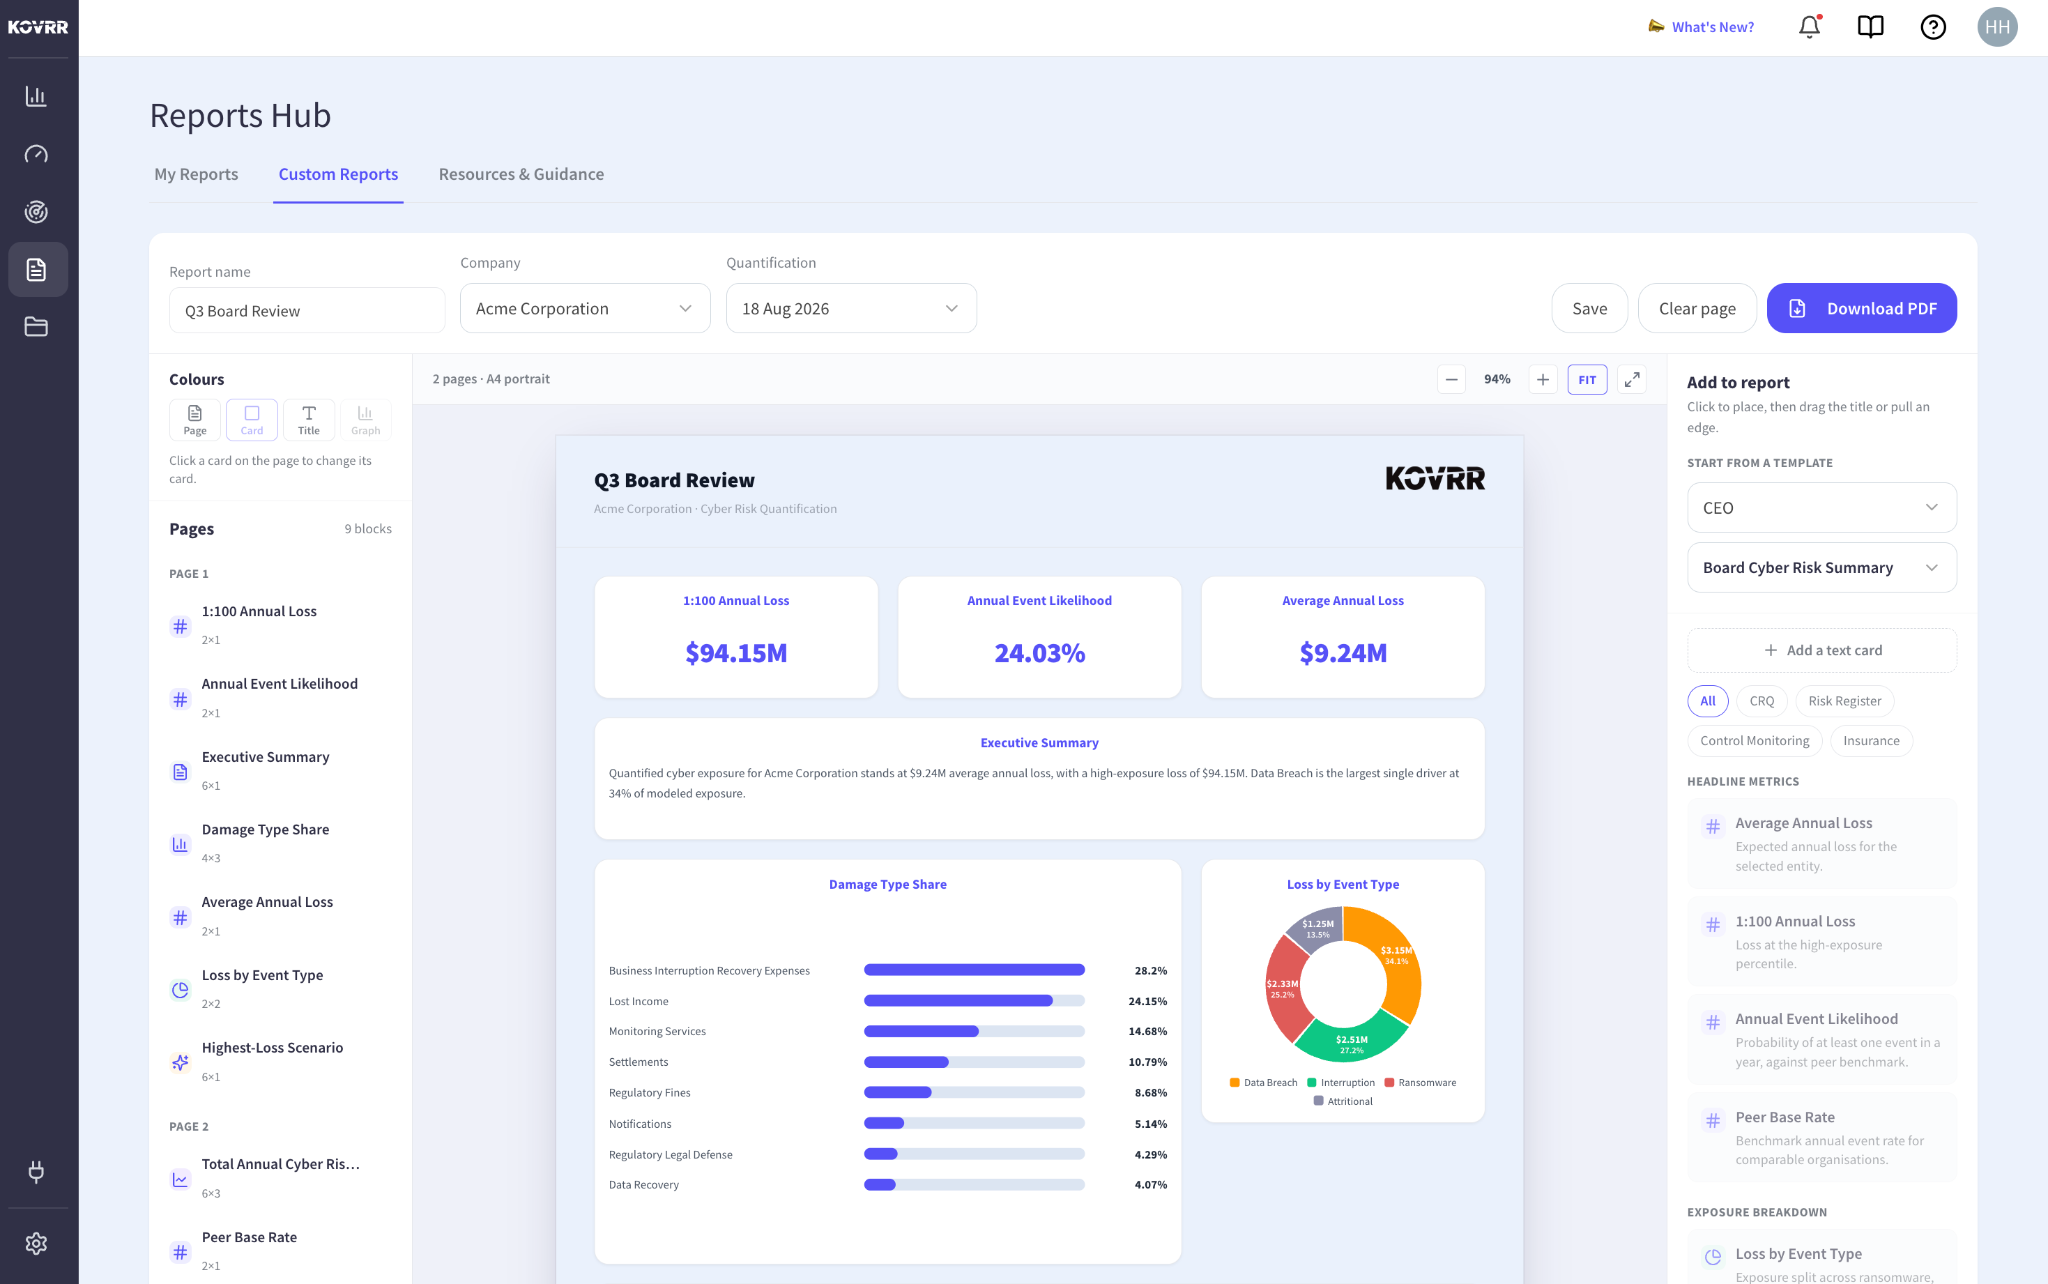
The result reads like a finished document while it is being assembled. Headline numbers sit across the top, a breakdown chart anchors the middle, a scenario or a curve follows underneath, and a written summary ties the page together. A user arranges these pieces in whatever order the conversation demands, recolors the whole report to match a brand, and exports the final version to PDF. The result is a polished report shaped entirely around the audience it was built for.
One Set of Numbers, Many Points of View
A custom report starts from a role. The builder offers templates shaped around the people who read cyber risk output, from the CEO and CFO through to the CISO, GRC lead, risk manager, compliance officer, and underwriter. Picking a role loads a starting arrangement suited to that audience, so a CEO opens to a board summary while an underwriter opens to an insurance submission. Each template is a considered starting point rather than a locked format.
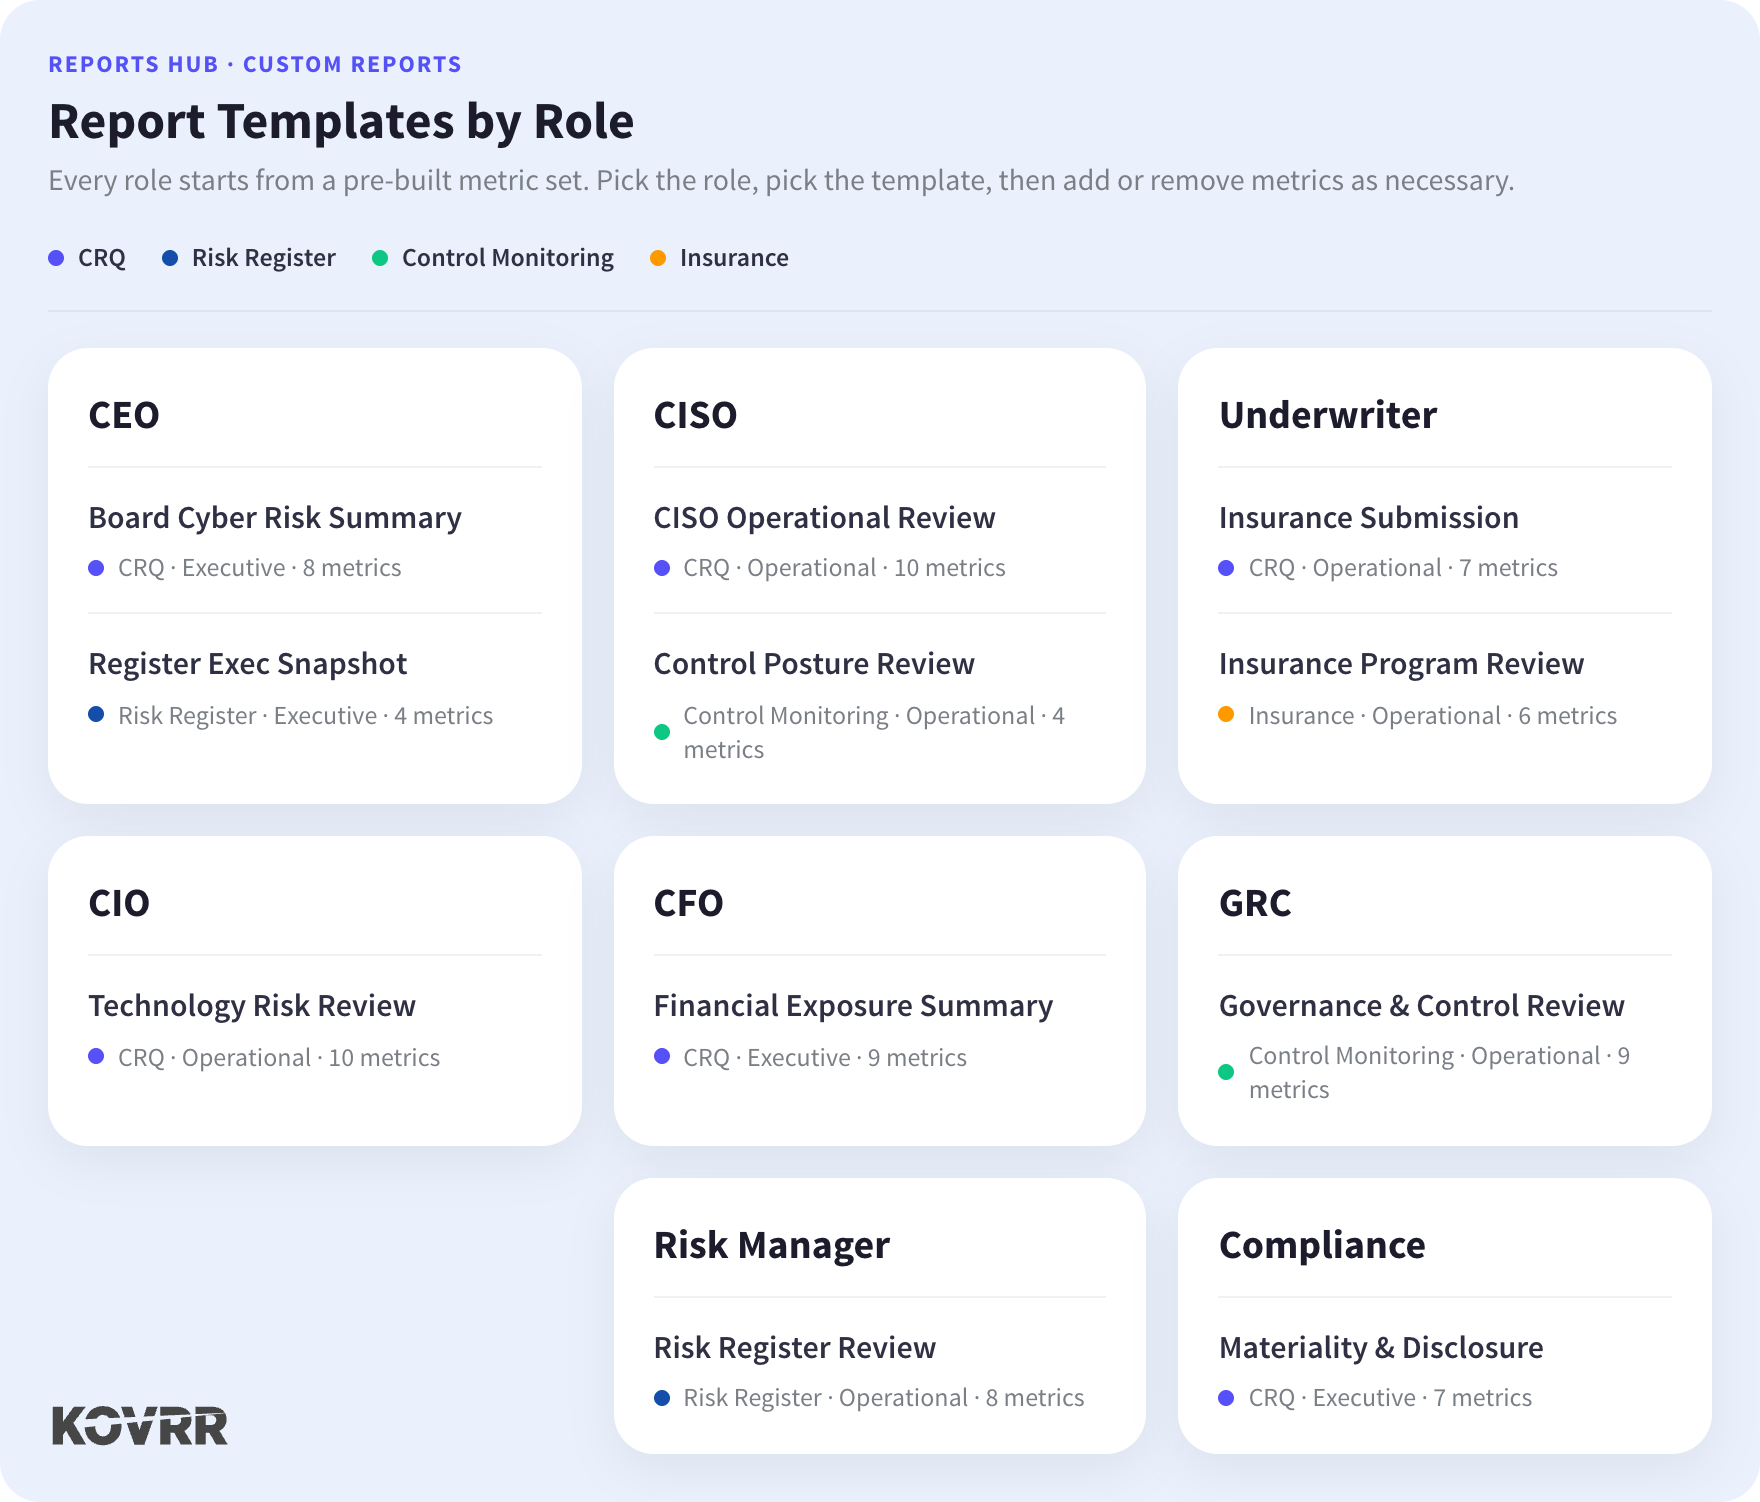
From there, the report bends to the exact conversation. A CFO reviewing exposure ahead of budget season wants headline loss figures and a breakdown by damage type. A compliance officer preparing a disclosure wants materiality thresholds and the likelihood of crossing them. A risk manager working the cyber risk register wants the top scenarios ranked by modeled loss. The quantification feeding all three is one and the same. The report each person receives is tailored to them alone.
The Same Data, Read Two Ways
Consider one entity with one quantification behind it. A CEO opens a board summary and sees the numbers that belong in a leadership discussion, including average annual loss, the high-exposure tail figure, the annual likelihood of an event, and a written summary naming the largest driver of exposure. The page speaks in financial terms and stays at the altitude a board conversation calls for, with the operational detail left out on purpose.
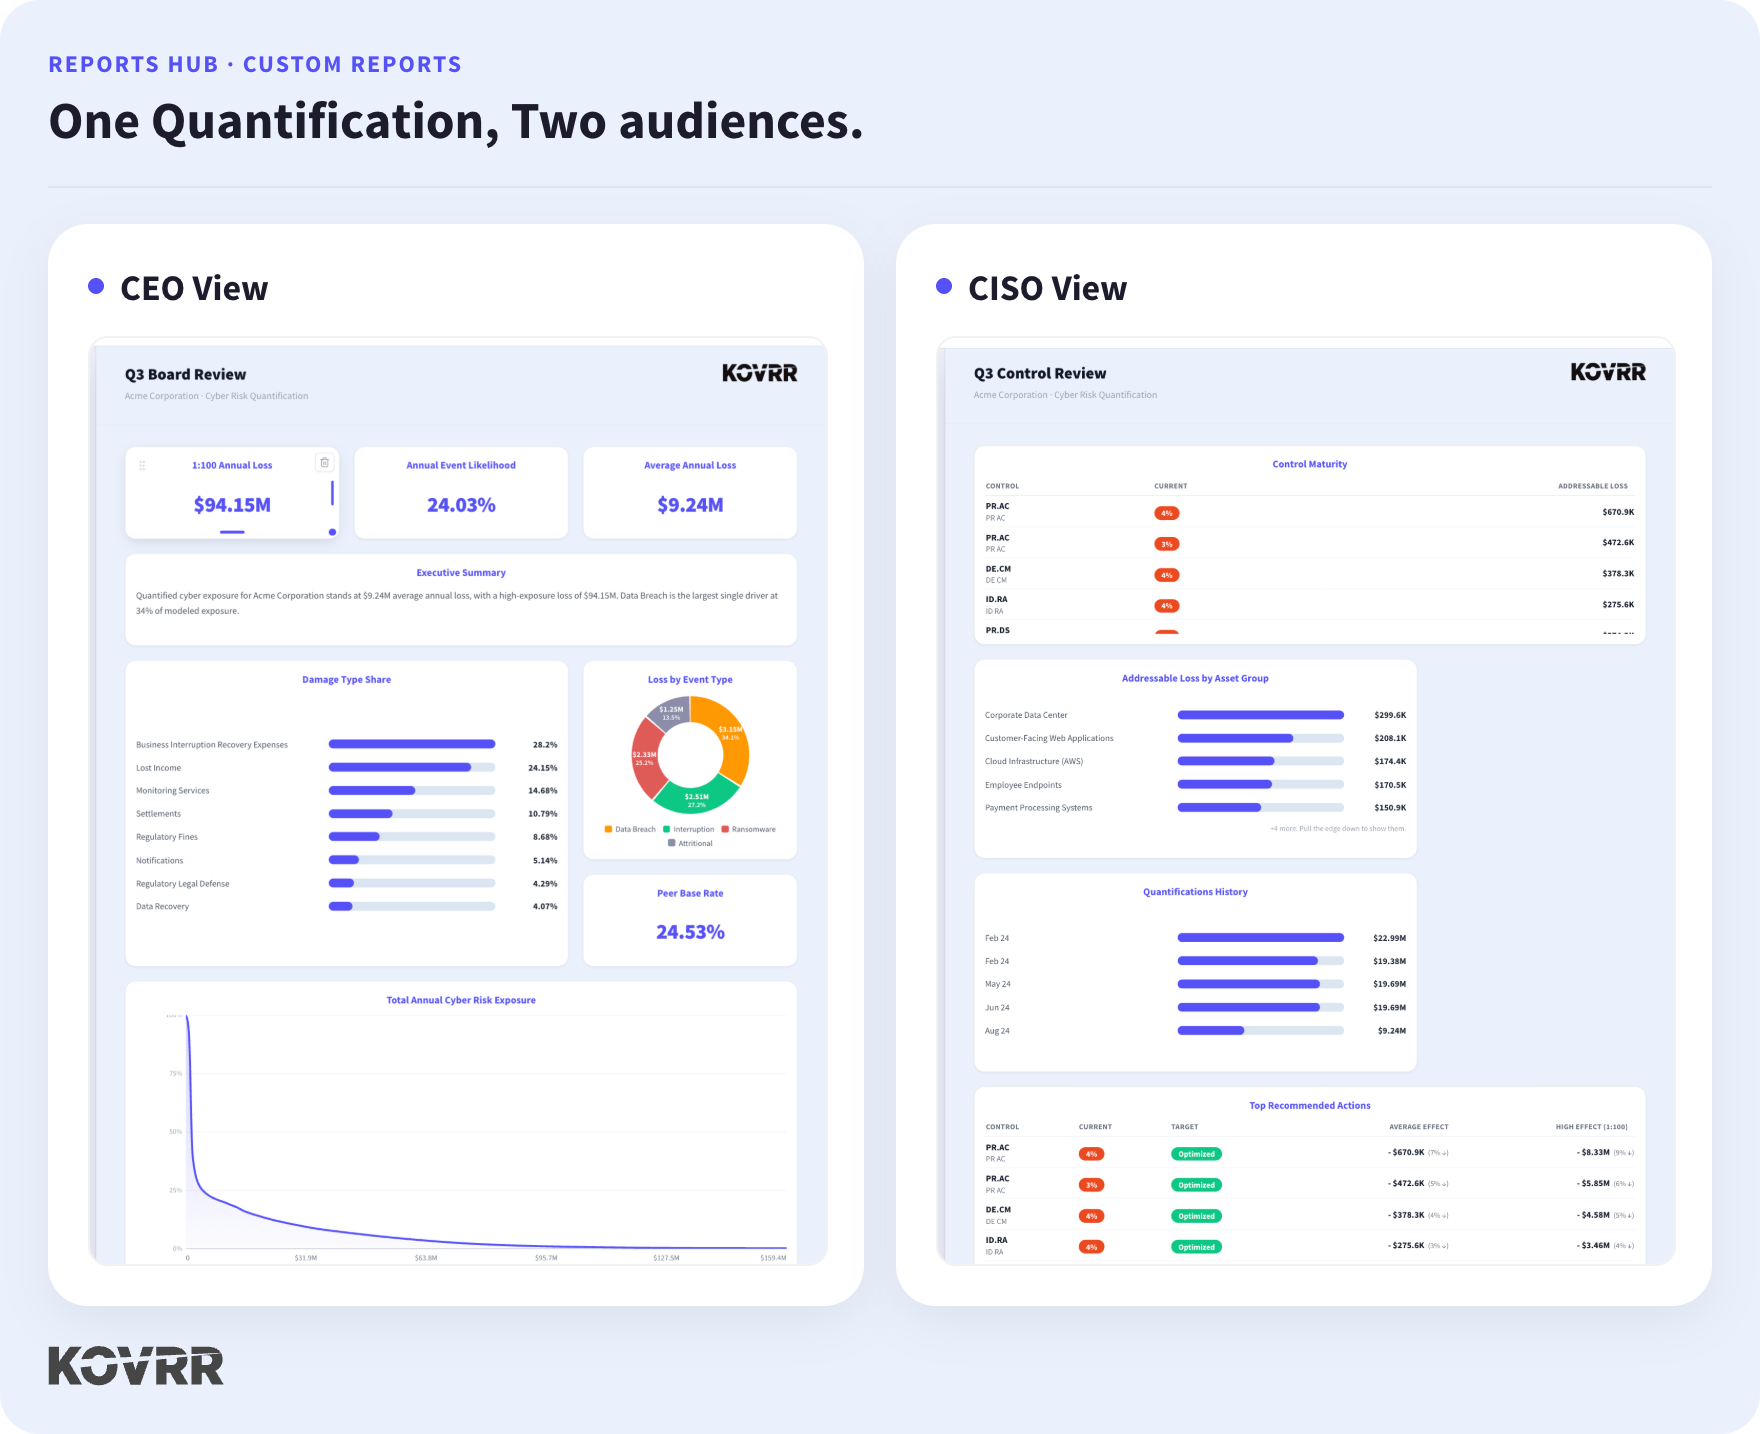
A CISO working from the same quantification builds something else entirely. The report opens on control maturity, with each control scored against the loss it leaves addressable, and continues into addressable loss by asset group and a ranked set of recommended actions showing what each control upgrade would remove. Nothing about the model changed between the two reports. What changed is the question each reader brought to it, and the composition answered accordingly.
A Deep Library of Metrics, Shaped by Its Users
Behind every template sits a library of report blocks that covers each part of the model. Headline metrics, exposure breakdowns, likelihood by driver, loss curves, risk register scenarios, control maturity, insurance views, and narrative text all live in one place, grouped by theme so the right block is quick to find. A template is a starting point drawn from this library, and any block can be added or removed until the report holds exactly what the moment needs.
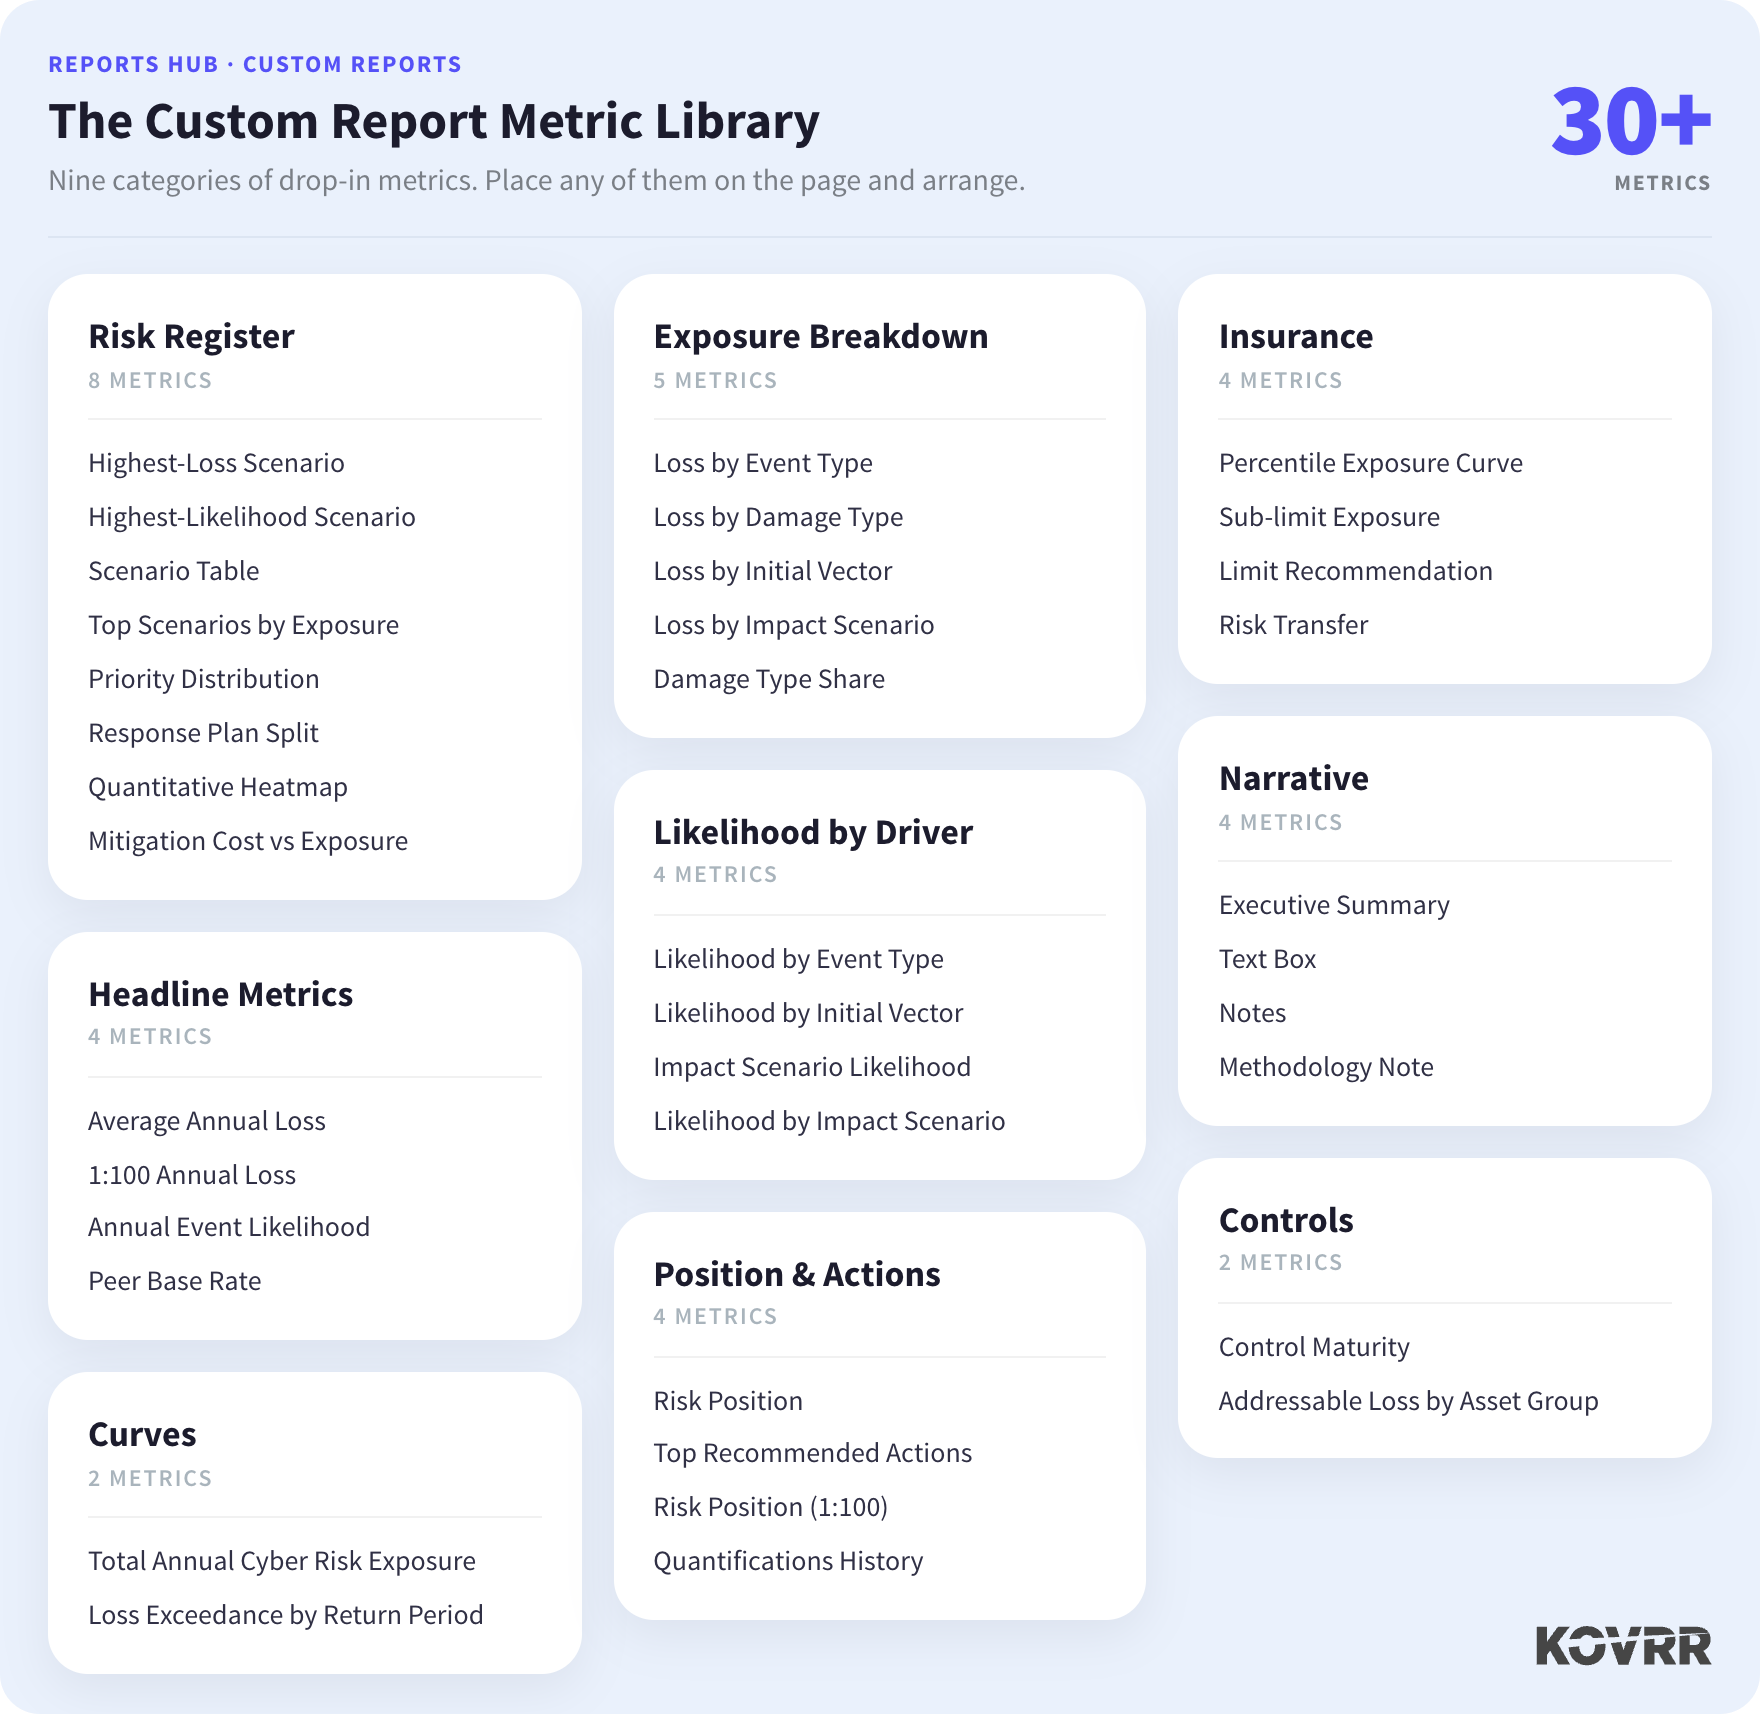
The library also stretches to fit how a team actually works. Once a composition proves useful, it can be saved as a reusable template and pulled up again for the next quarter or the next audience. Teams can bring in their own templates as well, so a format refined outside the platform becomes a repeatable starting point inside it. What began as a fixed set of role templates becomes a growing library shaped by the people who use it.
Reports Saved and Ready for Next Quarter
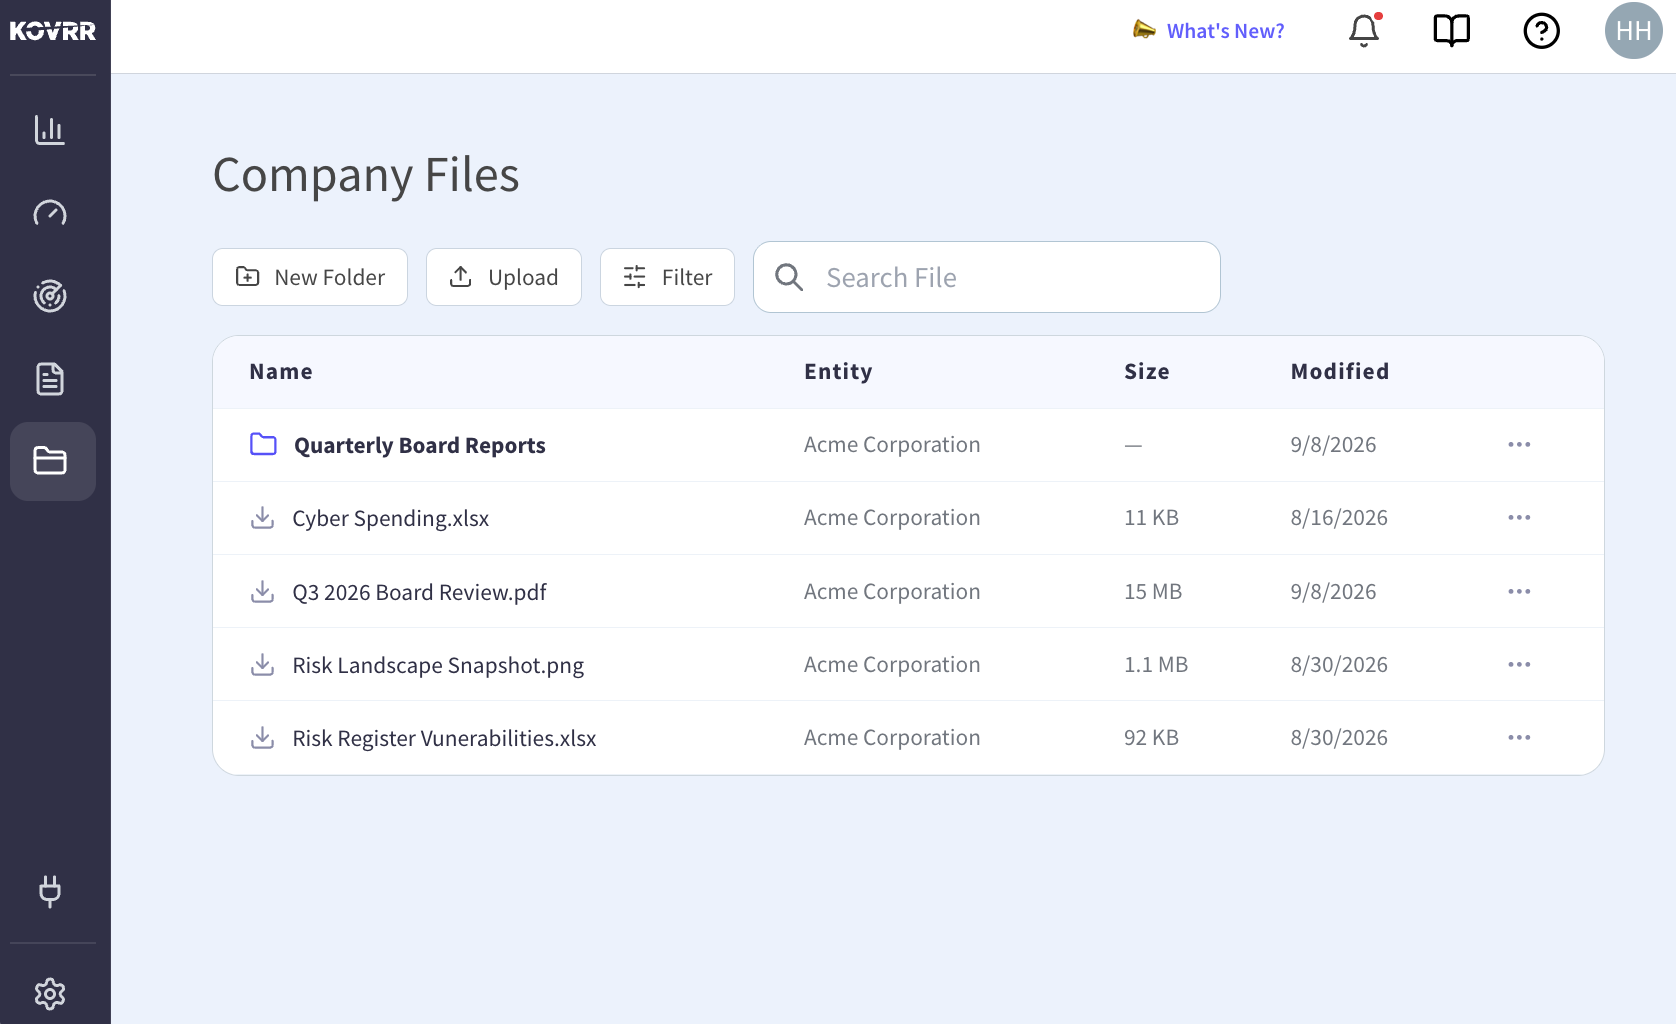
A finished report does not have to be rebuilt from scratch each quarter. Once a report is composed, it can be saved directly into Company Files, where it sits alongside the entity's other quantification records and supporting documents. The report stays in one place, ready to pull up whenever the next board meeting or audit request arrives, and it can be exported to PDF straight from Company Files for sending or presenting.
That storage turns each report into a reusable asset rather than a one-time export. A board summary built this quarter becomes the starting point for the next, and a team building toward a recurring review keeps its work in a shared, organized space. The effort spent composing the right report compounds over time instead of resetting with every new quantification.
Cyber Was Only the Starting Point: Extending to AI
The value was never in the numbers alone. It was in turning cyber risk into something a specific person could act on, framed for the choice in front of them. Quantification earns its place when it supports a decision, and a report earns its place when it puts the right figures in front of the right reader. Custom Reports is built around that idea, letting anyone shape the exact composition a moment calls for.
The same thinking now reaches past cyber. Kovrr applies the same quantification and visibility discipline to AI security and governance, where leaders face consequential decisions with less evidence than almost any other risk on the register. Cyber was where the loss data and the demand first came together, so it was the natural place to start. The method behind it, turning exposure into decisions leadership can weigh, was always meant to reach further.
Custom Reports turns quantified cyber risk into a report shaped for whoever needs to act on it. See it work on your own exposure in a live demo of the CRQ Platform.
If AI risk sits on your register too, the same approach carries across. Learn more with an AI Security and Governance Platform demo.