
Blog Post
Kovrr's Insurance Data Insights: Connecting Cyber Exposure to Coverage
July 21, 2026
TL;DR
- Cyber insurance decisions have historically been made without a quantified view of the organization's own exposure, leaving coverage terms anchored in broker benchmarks rather than modeled loss data.
- Kovrr's Insurance Data Insights brings coverage analysis into the same workspace as cyber risk quantification, giving security and finance leaders a shared basis for evaluating insurance terms against modeled exposure.
- The feature supports both regular and tower insurance structures, with each configuration analyzed against the entity's quantified risk profile.
- A detailed exposure curve plots loss against percentile with insurance terms overlaid, surfacing where current coverage sits relative to expected losses.
- The Sub-limit Exposure section breaks modeled loss down across the event categories most commonly referenced in cyber insurance underwriting.
- Insurance Insights & Recommendations synthesizes the analysis into actionable guidance, surfacing coverage status and first-pass benchmarks for limits, retention, and premium.
Most Organizations Insure Against Cyber Risk They Haven't Measured
Cyber insurance has become a standard line item in enterprise risk management, and for good reason. The financial consequences of a significant cyber event, whether a ransomware attack that halts operations for weeks or a data breach that triggers regulatory scrutiny and third-party liability, can far exceed what any operational budget was sized to absorb. Insurance exists to handle that tail. Most organizations recognize this benefit and carry a policy. Far fewer, however, can say with measured certainty that the coverage they hold reflects the risk they face.
Cyber insurance decisions have historically been made without a quantified view of the organization's own exposure. Brokers provide market benchmarks, and underwriters conduct questionnaires. Yet neither process puts the organization's modeled loss distribution at the center of the conversation. Limits get set based on what seems reasonable relative to industry norms, while deductibles are negotiated without a clear picture of how frequently losses are expected to fall below that threshold. The result is coverage that's misaligned.
Kovrr's Insurance Data Insights was designed to change that dynamic, giving organizations a quantified basis for the coverage negotiations that have long been conducted without one. Anchored in the organization's modeled cyber exposure, the feature gives security and finance leaders the data needed to evaluate terms, better understand where limits sit relative to modeled loss scenarios, and approach insurance decisions with the same financial rigor applied to the rest of the risk program.
Insurance Data Insights Portfolio View
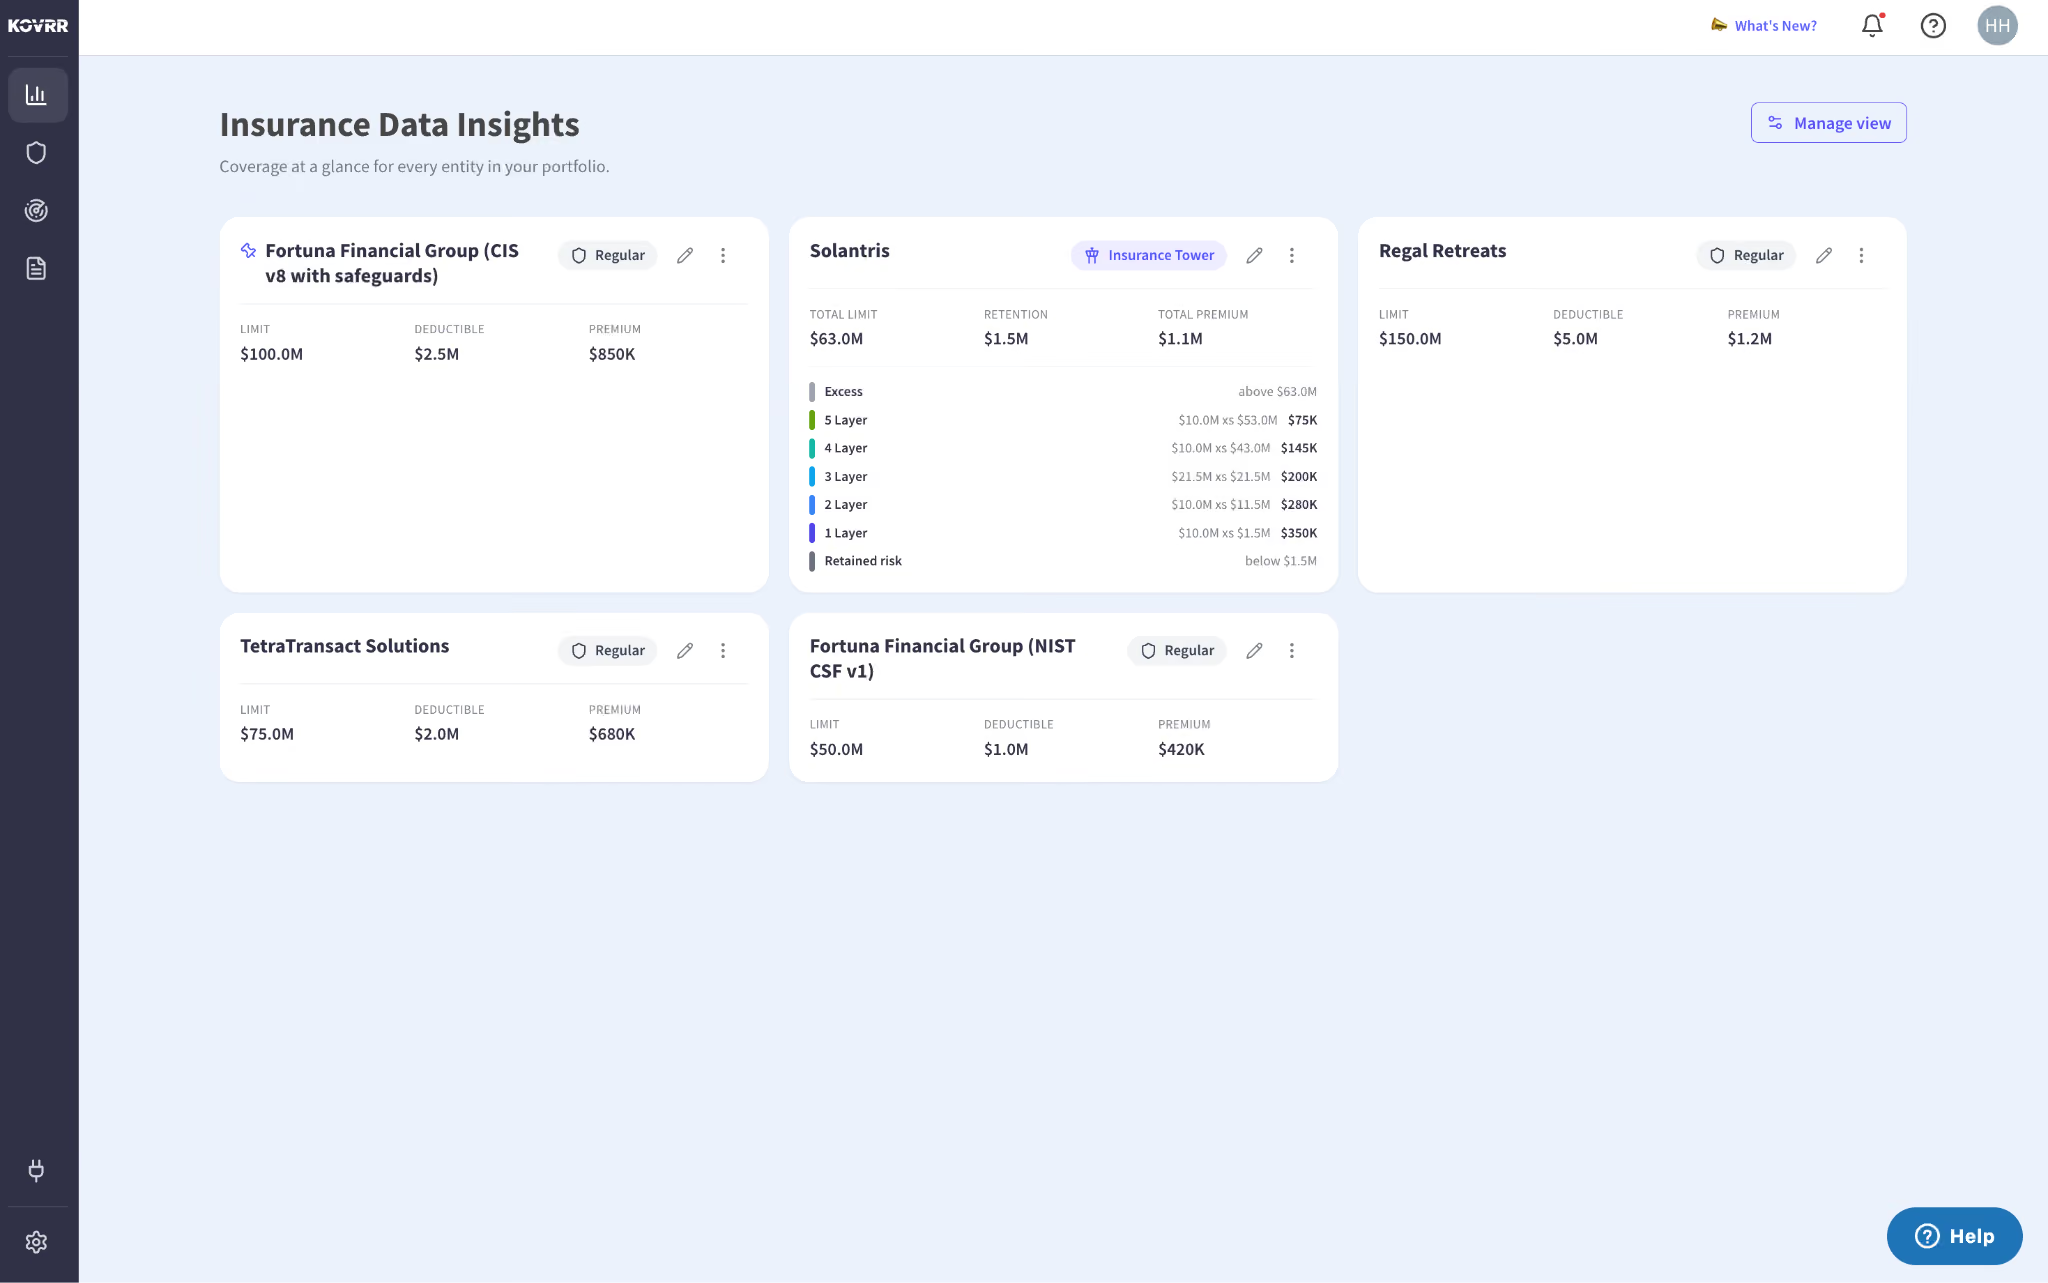
The Insurance Data Insights feature is accessible from Kovrr's main navigation and opens to an overview of every entity that has run a cyber risk quantification (CRQ) and its associated coverage terms. Each entity card displays the insurance coverage type, limit, deductible, and premium at a glance, giving risk and finance leaders an immediate read on how insurance is distributed across the organization. Entities for which coverage terms have not yet been entered will display accordingly, and can be updated at any time.
Entities configured with a standard policy display a single limit, deductible, and premium, while those structured as tower programs surface the full layer stack directly on the card, including each layer's coverage range and associated premium, with the total limit, retention, and program premium shown at the top. The view makes it possible to compare coverage across entities without having to navigate into each one individually.
Configuring Insurance Terms
Before the platform can surface exposure analysis alongside coverage data, users first need to enter the insurance terms associated with each entity. The input form is accessible directly from the entity card on the home view and displays the entity's Average Annual Loss and Catastrophic Event (1:100) figures at the top, grounding the configuration process in the organization's modeled exposure from the outset.
Regular Coverage
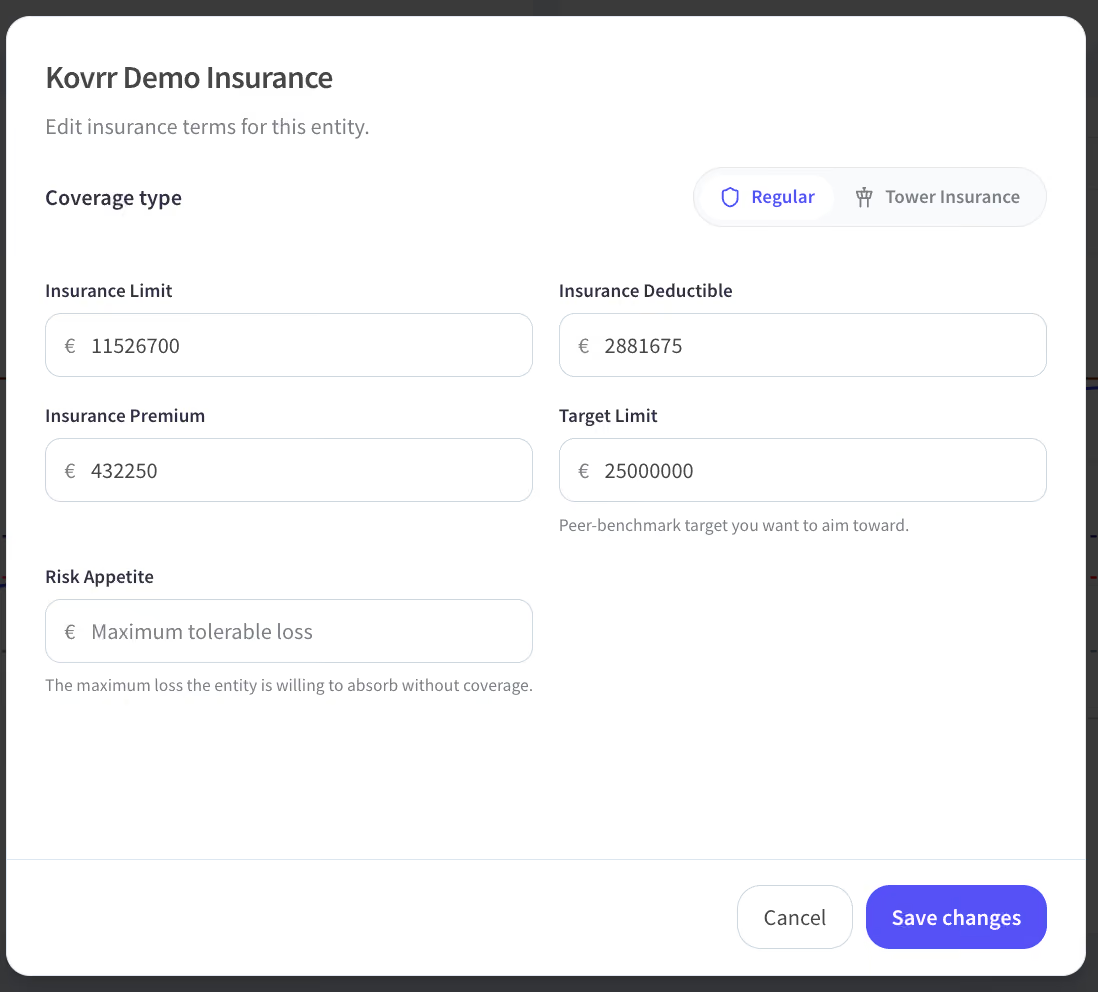
Users selecting a regular policy enter the insurance limit, deductible, premium, and risk appetite, defined as the maximum loss the entity is willing to absorb without coverage. Once entered, these terms are plotted directly against the entity's modeled loss distribution, giving risk and finance leaders an immediate view of how current coverage aligns with quantified cyber exposure. The inputs also inform the recommendations surfaced later in the feature.
Insurance Tower
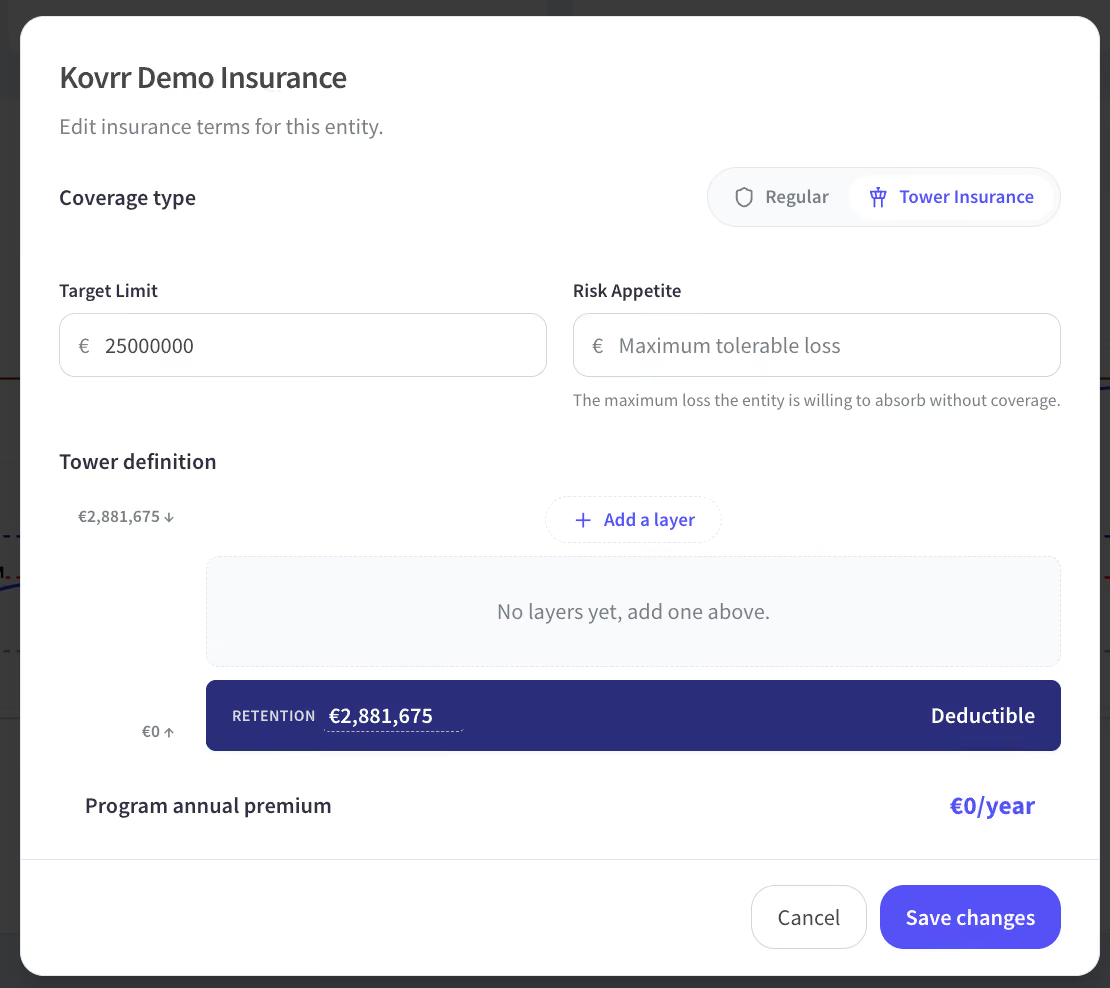
Organizations with more complex coverage structures can select the Insurance Tower option instead. Rather than a single limit and deductible, users define a full layer stack, with each layer specifying a limit, an excess point, and an annual premium. Layers can be added incrementally, and the form calculates the program's total annual premium as the stack is built out. A retention figure at the base of the tower reflects the amount the organization absorbs before any coverage applies.
Annual Cyber Risk Exposure
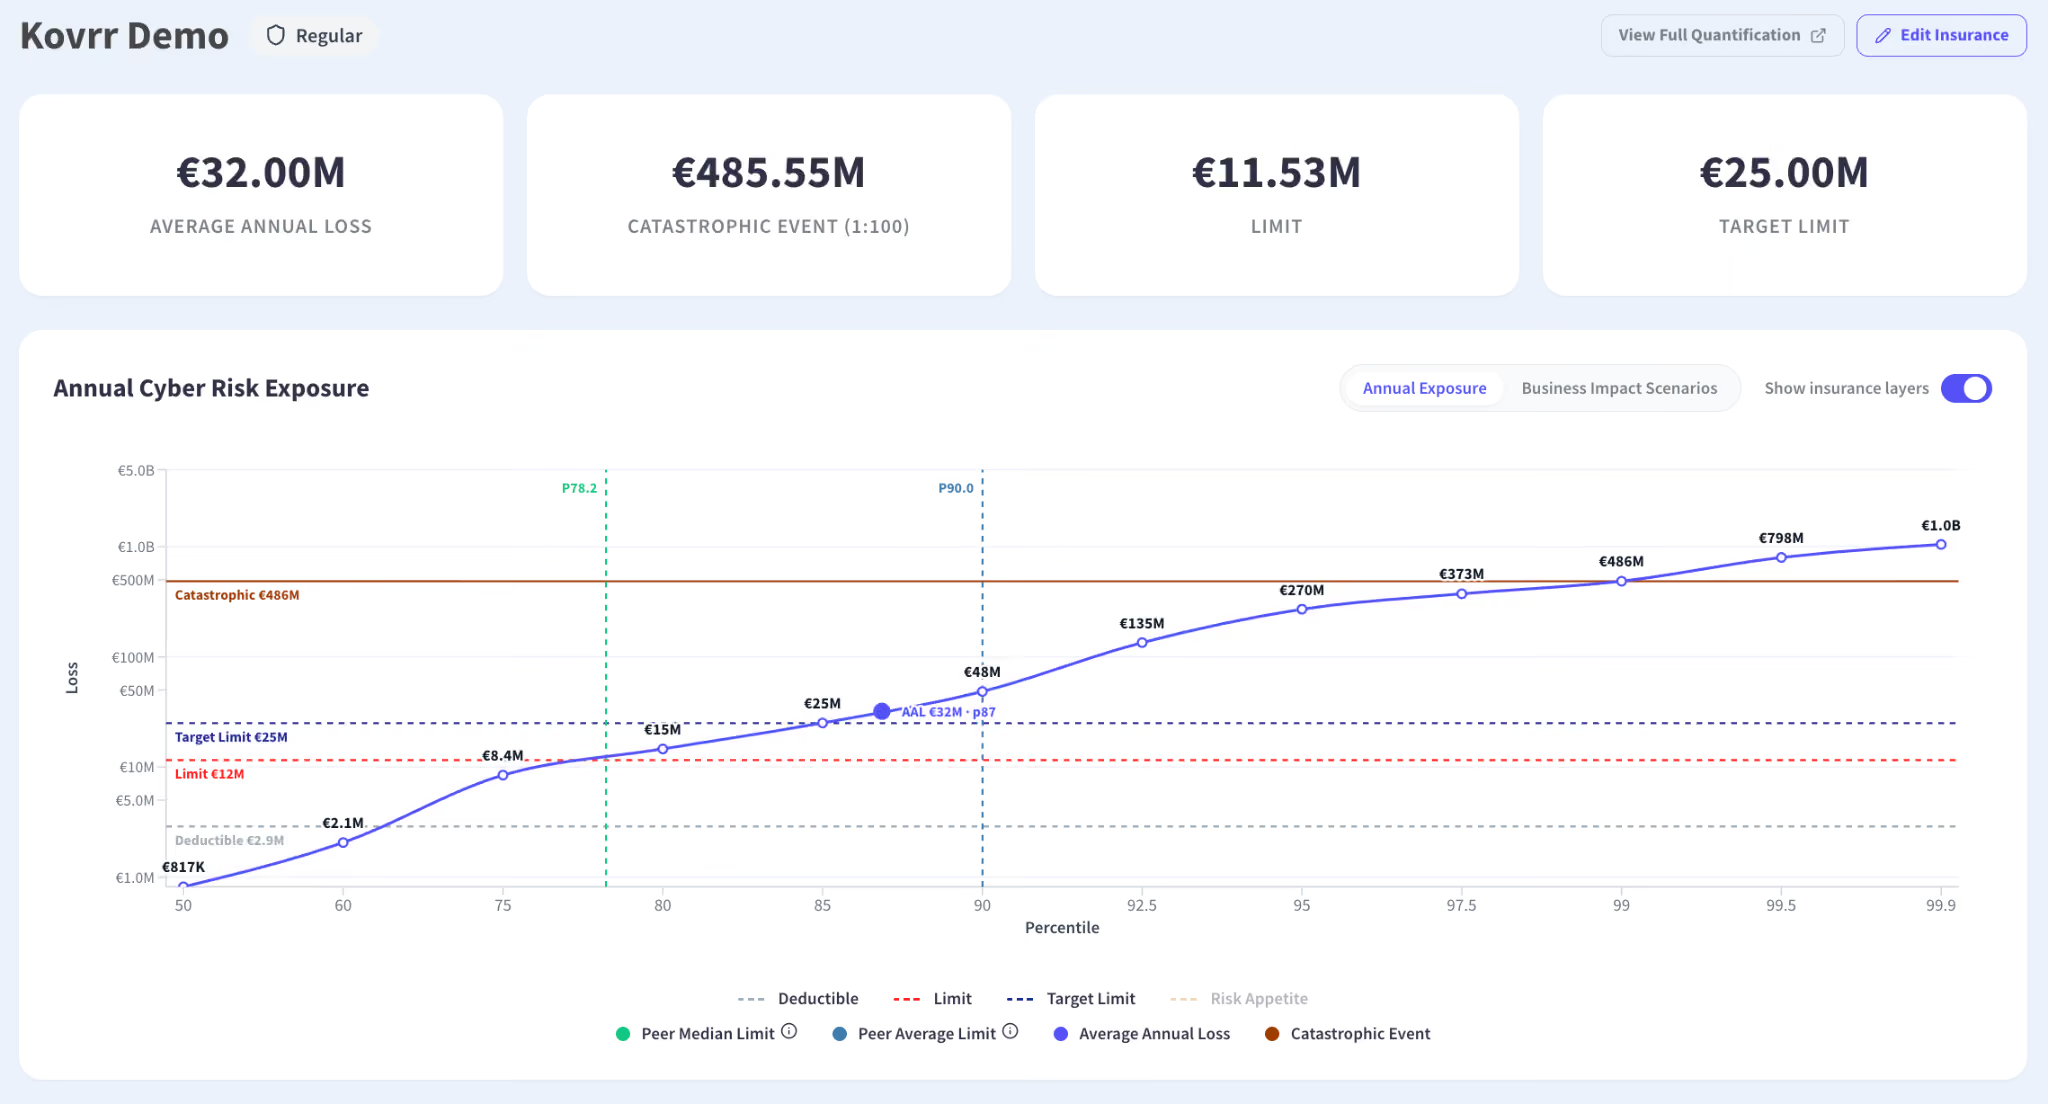
Once insurance terms have been entered, the entity view surfaces a detailed picture of how coverage maps to modeled exposure. Four top-line metrics, Average Annual Loss, Catastrophic Event (1:100), Limit, and Target Limit sit above the curve, giving risk and finance leaders an immediate financial reference point before diving into the distribution below.
Annual Exposure
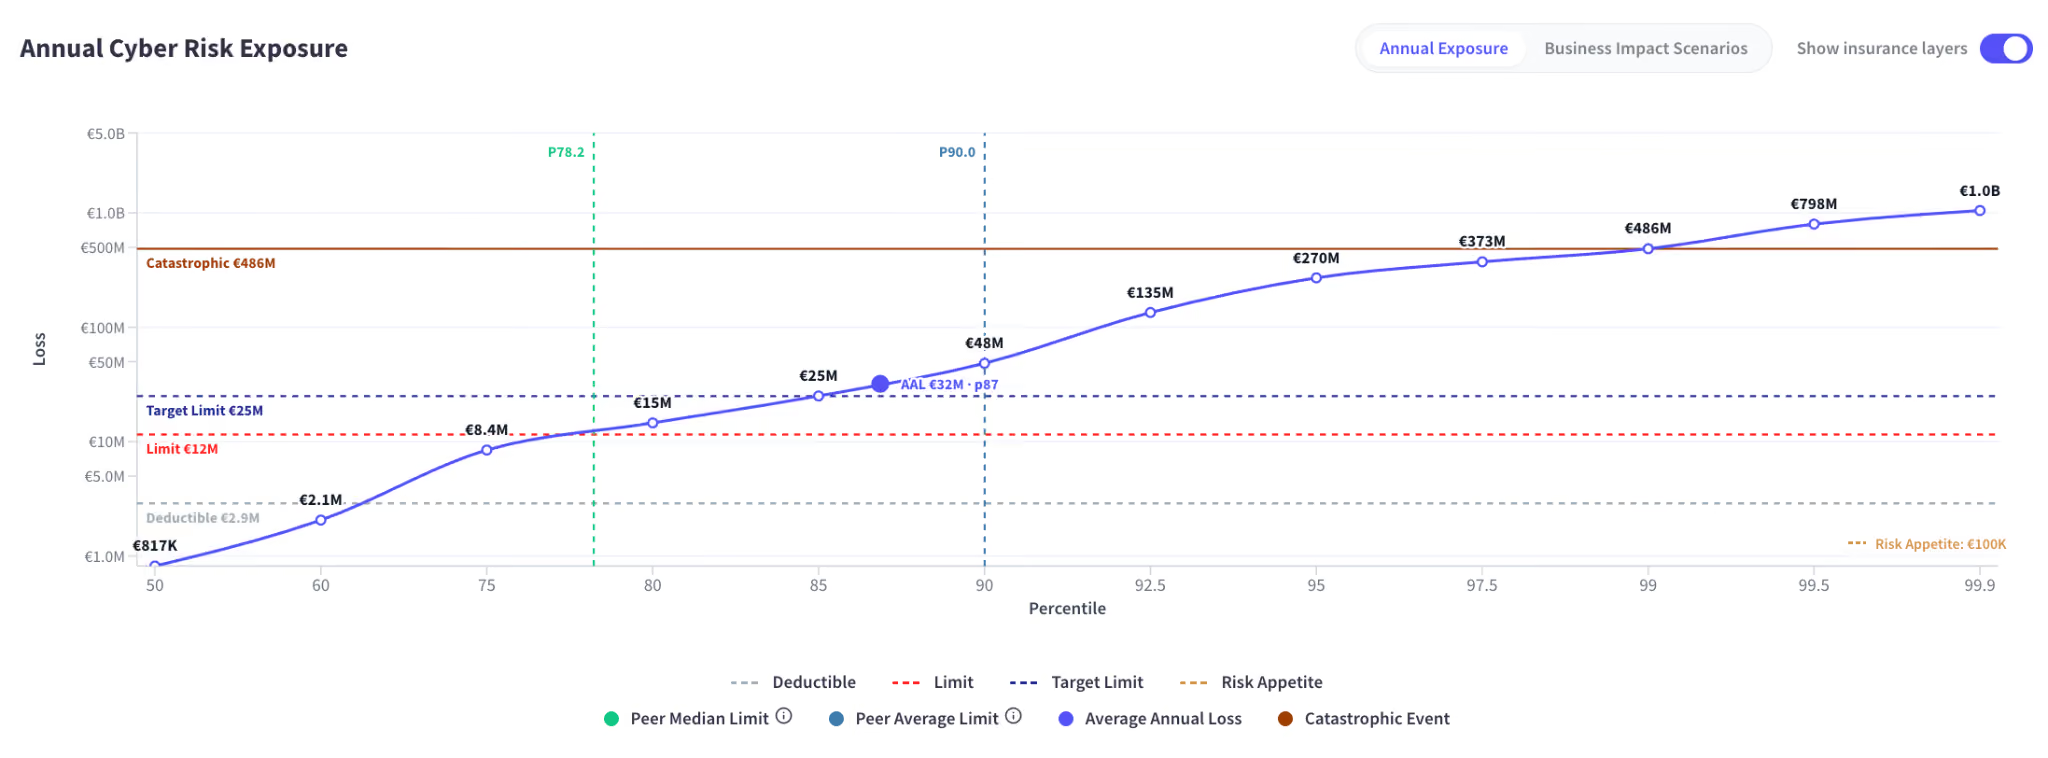
The Annual Exposure curve plots loss against percentile rather than probability, giving users a more intuitive read on where losses are expected to concentrate and how coverage terms sit relative to that distribution. The insurance limit, deductible, target limit, and risk appetite are each rendered as horizontal reference lines on the curve, making it immediately visible whether current coverage is positioned above or below the organization's expected loss range.
Peer Median and Peer Average limit markers are also plotted on the curve, drawn from market data matched to the entity's industry, geography, and revenue, providing a benchmark for evaluating how the organization's coverage compares to peers facing similar risk profiles.
Business Impact Scenarios
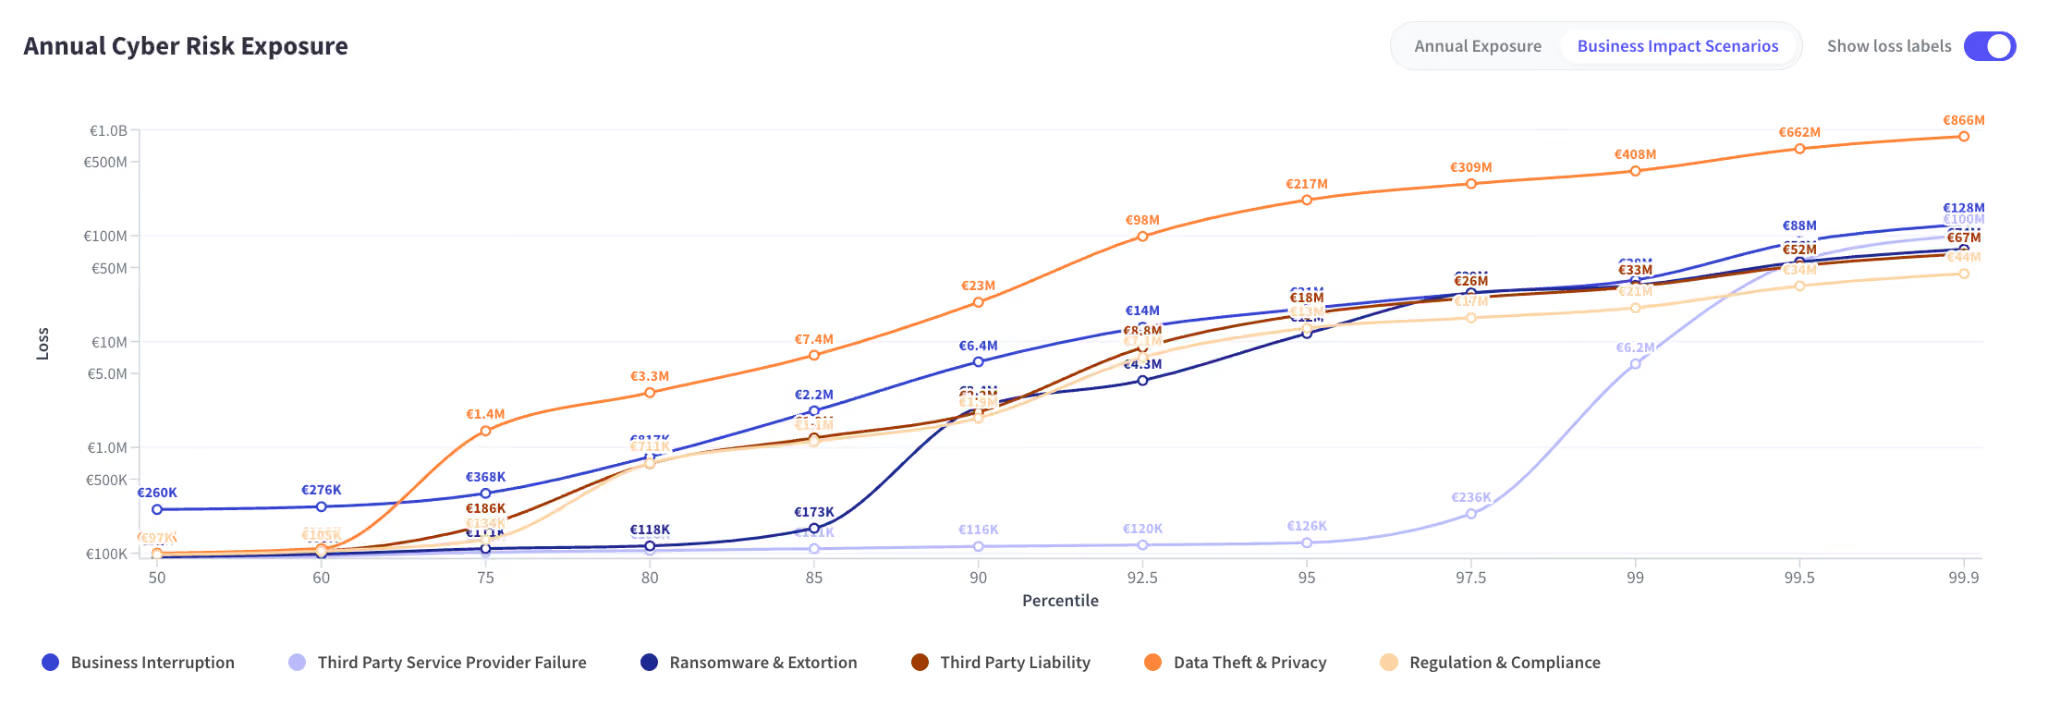
Switching to the Business Impact Scenarios tab replaces the aggregate curve with a set of individual loss distributions, one for each simulated event type. The event categories, Business Interruption, Ransomware & Extortion, Third Party Liability, Data Theft & Privacy, Third Party Service Provider Failure, and Regulation & Compliance, are organized around the loss types most commonly referenced in cyber insurance underwriting, making the breakdown directly relevant to coverage discussions.
Each scenario is plotted separately, allowing users to see how exposure concentrates differently across event types at various percentile thresholds. Where the Annual Exposure view gives a complete picture of overall loss, the Business Impact Scenarios tab identifies which event types are driving the most exposure and at what severity levels.
Sub-limit Exposure
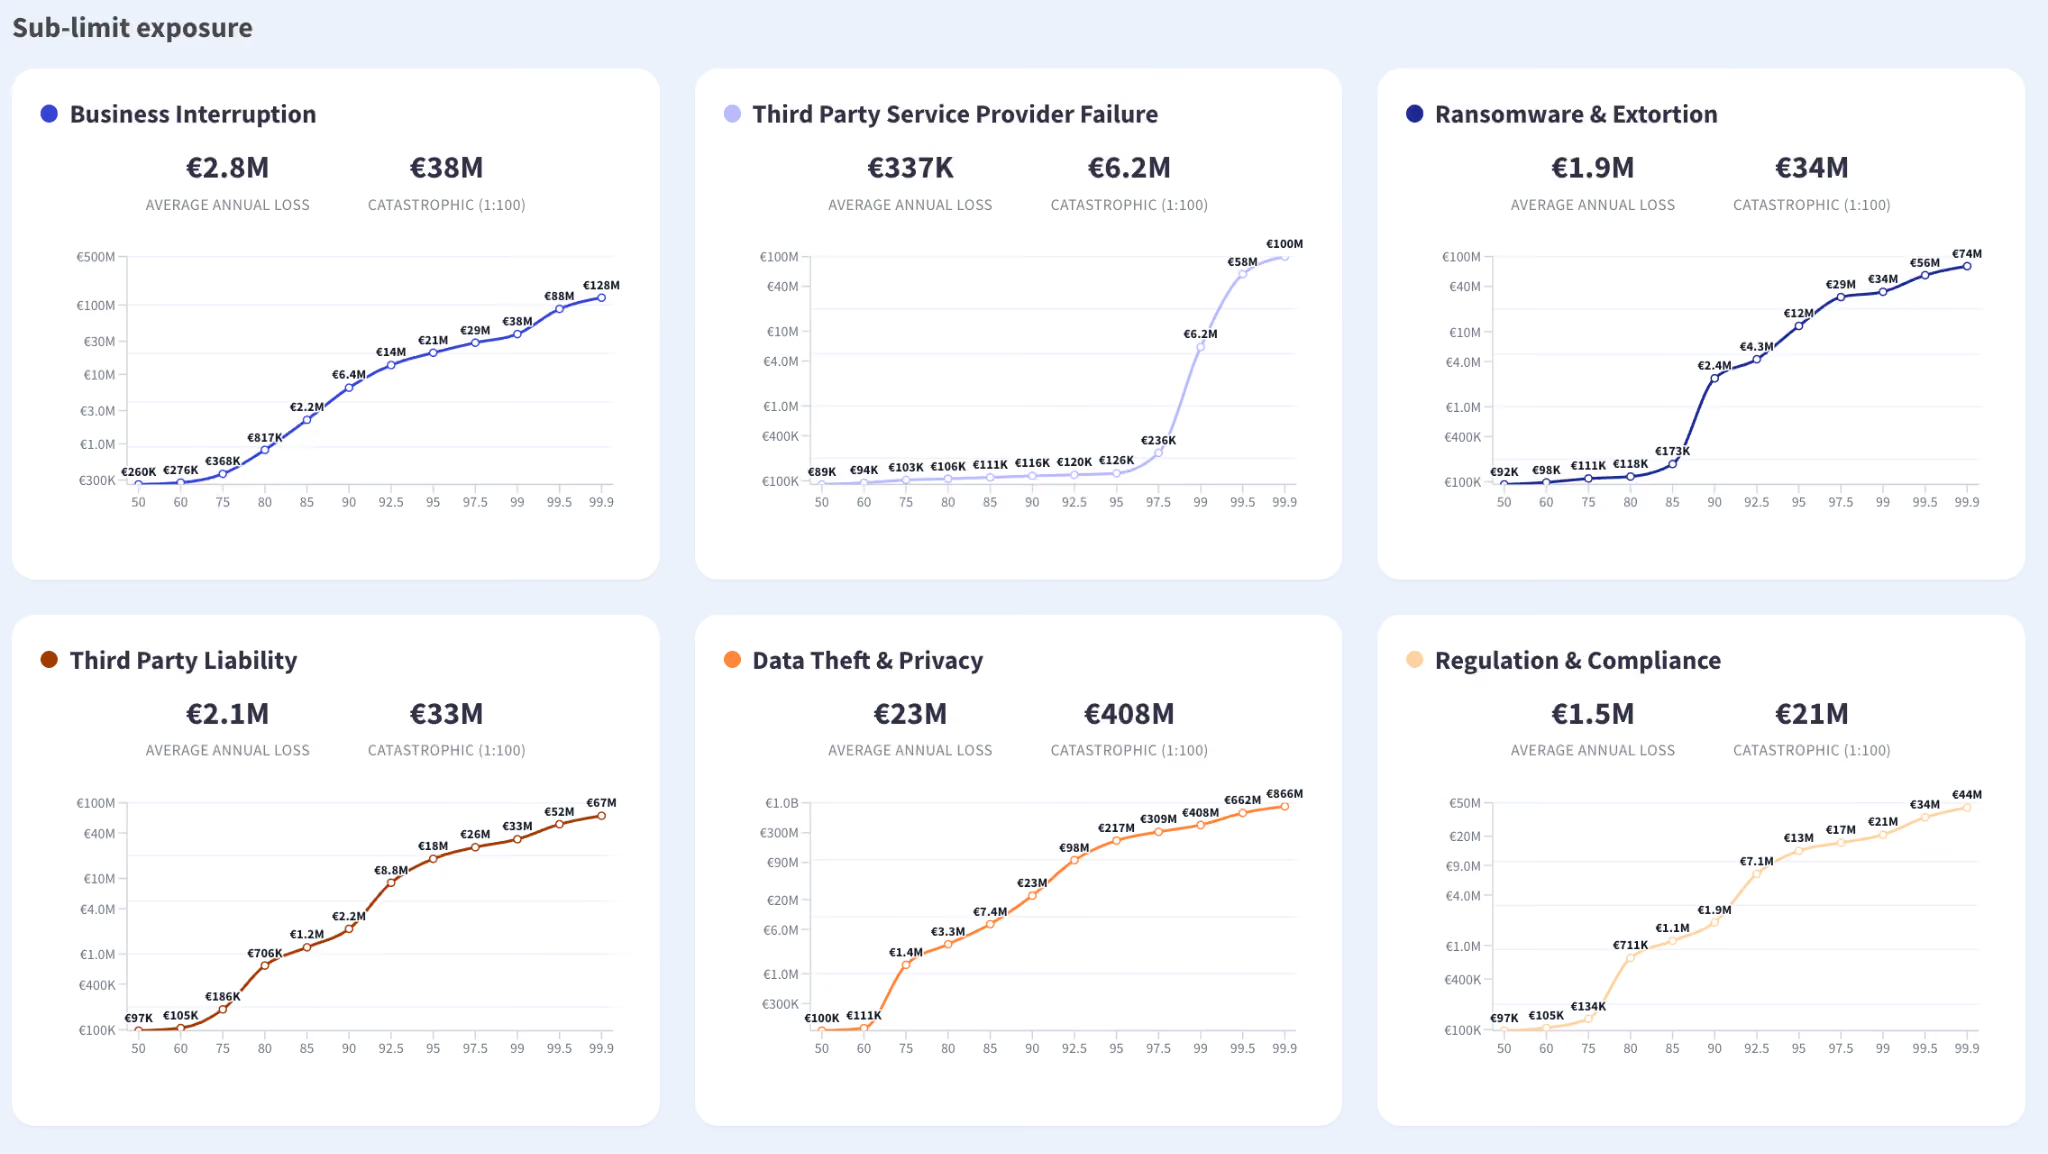
Cyber insurance policies frequently include sublimits, coverage caps that apply to specific event types rather than the policy as a whole. A policy with a $50 million overall limit, for instance, may cap ransomware-related losses at $10 million or business interruption coverage at $15 million. Organizations that don't have a data-driven understanding of their exposure by event type are effectively negotiating those sublimits blind, with no quantified basis for determining whether the caps they agree to are appropriate for their risk profile.
The Sub-limit Exposure section resolves that uncertainty by breaking modeled loss down across the six event categories. Each card displays the Average Annual Loss and Catastrophic Event (1:100) figure for that category alongside a loss distribution curve, giving organizations a granular view of where exposure concentrates across different severity thresholds. Taken together, these six views give risk and finance leaders the data needed to evaluate whether existing sublimits reflect modeled exposure, and where coverage may warrant renegotiation.
Tower Insurance Insights
The views covered thus far are also applicable to entities configured with an Insurance Tower policy, with the exception of two, adapted to reflect the layered structure of the coverage program. The Annual Cyber Risk Exposure curve renders each tower layer as a distinct coverage band, and the Insurance Insights & Recommendations section extends with a per-layer economics table that evaluates the efficiency of each layer in the stack.
Annual Cyber Risk Exposure with Layered Coverage
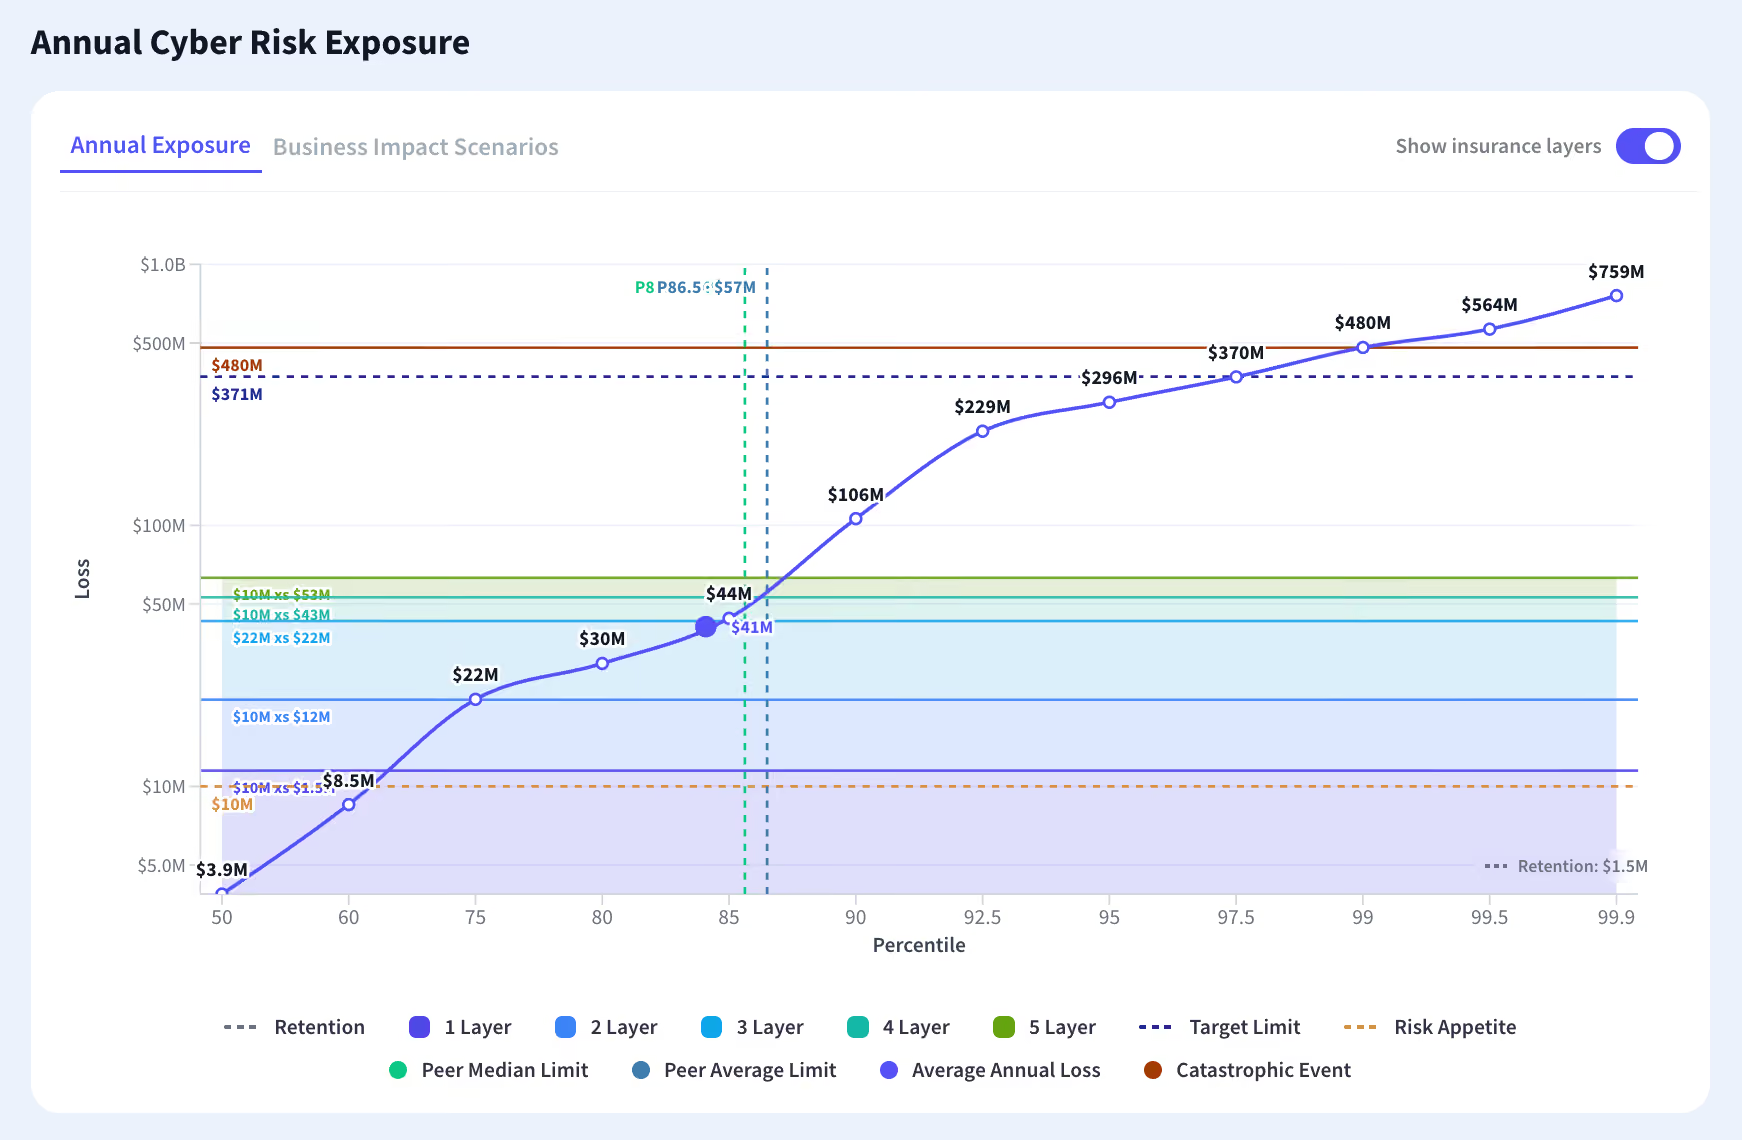
For entities configured with a tower policy, the Annual Cyber Risk Exposure curve replaces the single limit line with a stacked set of coverage bands, one for each layer in the program. Layer 1 sits at the bottom, anchored at the retention point, with subsequent layers stacked above. The modeled loss curve is overlaid on top, making it immediately visible which layers absorb expected losses and where exposure extends beyond the top of the tower into uninsured territory.
The visualization gives risk and finance leaders a more granular read on how each layer contributes to the program's overall coverage, rather than treating the tower as a single aggregate limit.
Tower Insurance Optimization
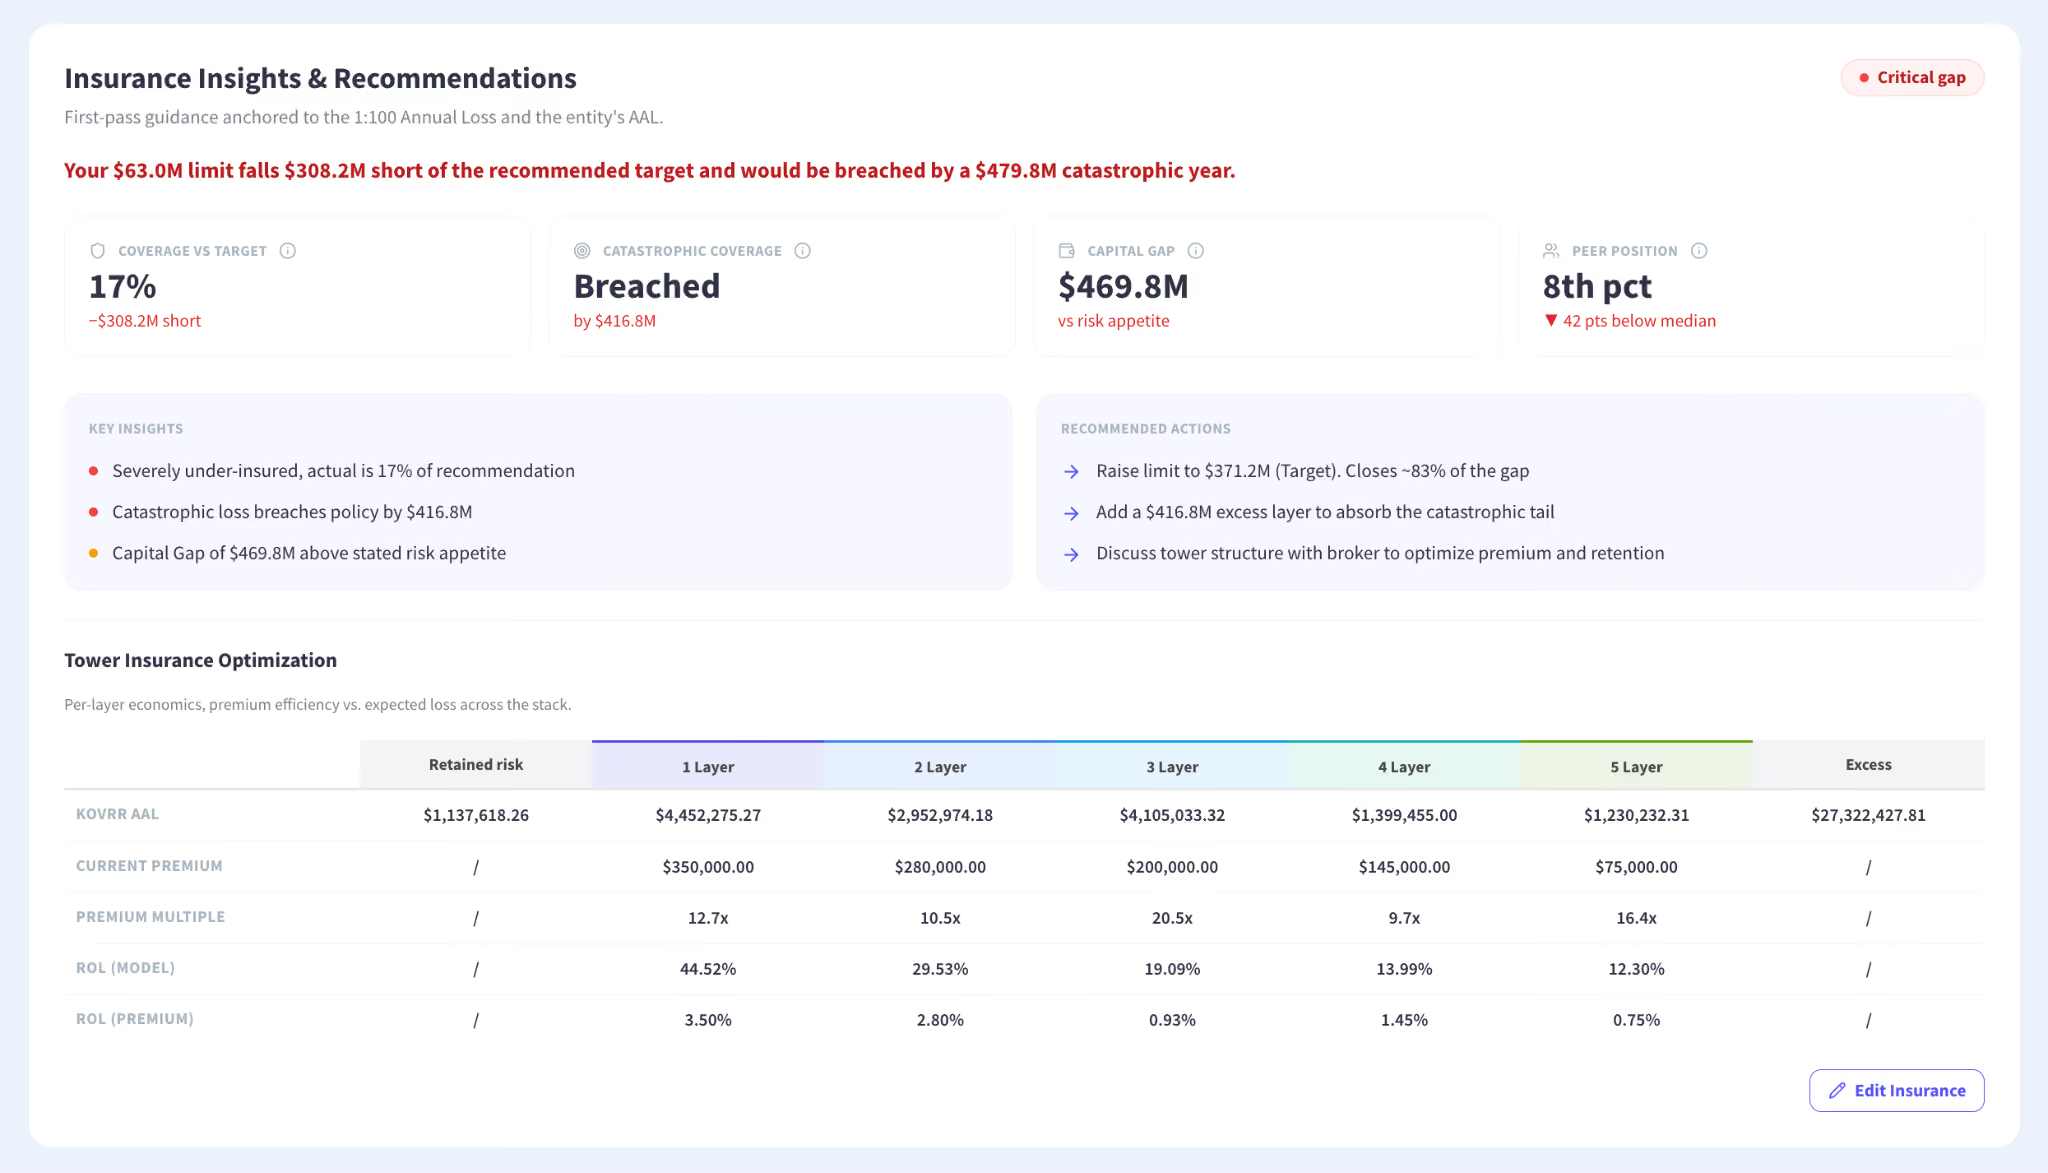
The Tower Insurance Optimization table sits beneath the standard Insurance Insights & Recommendations content and breaks down the economics of each layer in the tower program. Five rows of analysis are displayed for each layer, including the Retained Risk and Excess columns. Kovrr AAL surfaces the modeled Average Annual Loss attributable to each layer, giving organizations a quantified view of where expected losses concentrate within the stack.
Current Premium displays the annual premium paid for that layer, and Premium Multiple expresses the relationship between the two, showing how many times the modeled loss the premium represents. ROL (Model) and ROL (Premium) provide complementary rate-on-line metrics, with the former calculated against modeled exposure and the latter against the layer's actual premium, making it possible to evaluate whether each layer is appropriately priced relative to the risk it covers.
Aligning Cyber Insurance With Cyber Risk Reality
Cyber insurance has long operated at arm's length from the rest of an organization's risk program. Coverage terms get negotiated in conversations that rarely include the security team, while CISOs evaluate exposure in frameworks that rarely translate into the dollar figures that drive insurance decisions. Organizations are left carrying coverage that may bear little relationship to their actual risk profile, with both sides working from incomplete information.
Kovrr's Insurance Data Insights brings these two critical perspectives into the same workspace. By anchoring coverage analysis in quantified exposure, the feature gives security and finance leaders a shared, defensible basis for evaluating policy terms, identifying coverage shortfalls, and approaching renewal and negotiation conversations with the data needed to advocate for terms that reflect modeled risk.
To see how Insurance Data Insights can support your organization's coverage decisions, schedule a free demo with one of Kovrr's cyber risk management experts today.