
Blog Post
Quantifying Cyber Risk With No Incident History
September 4, 2026
A company too young or too small to have an incident history still has to answer the underwriter at renewal, the enterprise customer running a security review, and the board asking what the exposure is. The usual objection is that quantification needs a baseline and there is none.
The objection rests on a mistaken assumption about how these models work. Almost nobody's figure runs on their own incident history, so the young company is in the same position as everyone else on the term it worries about most.
Whose Incident History Does a Model Use?
Not the customer's, in any credible implementation. An organization operating for twenty years might have two or three significant events, which is not a sample anyone could estimate a rate from.
Frequency comes from industry loss data covering large populations of organizations, adjusted for the sector, the size and the control position of the specific company. The same holds for the twenty-year-old business and the two-year-old one, and neither is contributing much to the frequency term from its own records.
So Where Does the Company's Own Data Enter?
On the severity side and the control side. What the business would lose comes from its own asset values, revenue, data volumes and dependencies. What reduces the likelihood comes from its own control implementation. Both are observable today rather than accumulated over years, which is why a young company can produce a defensible figure in the same timeframe as anyone else.
What Is Genuinely Harder Without History?
Four things, and none of them is frequency. Being precise about which ones matter is what separates a real limitation from an inherited assumption.
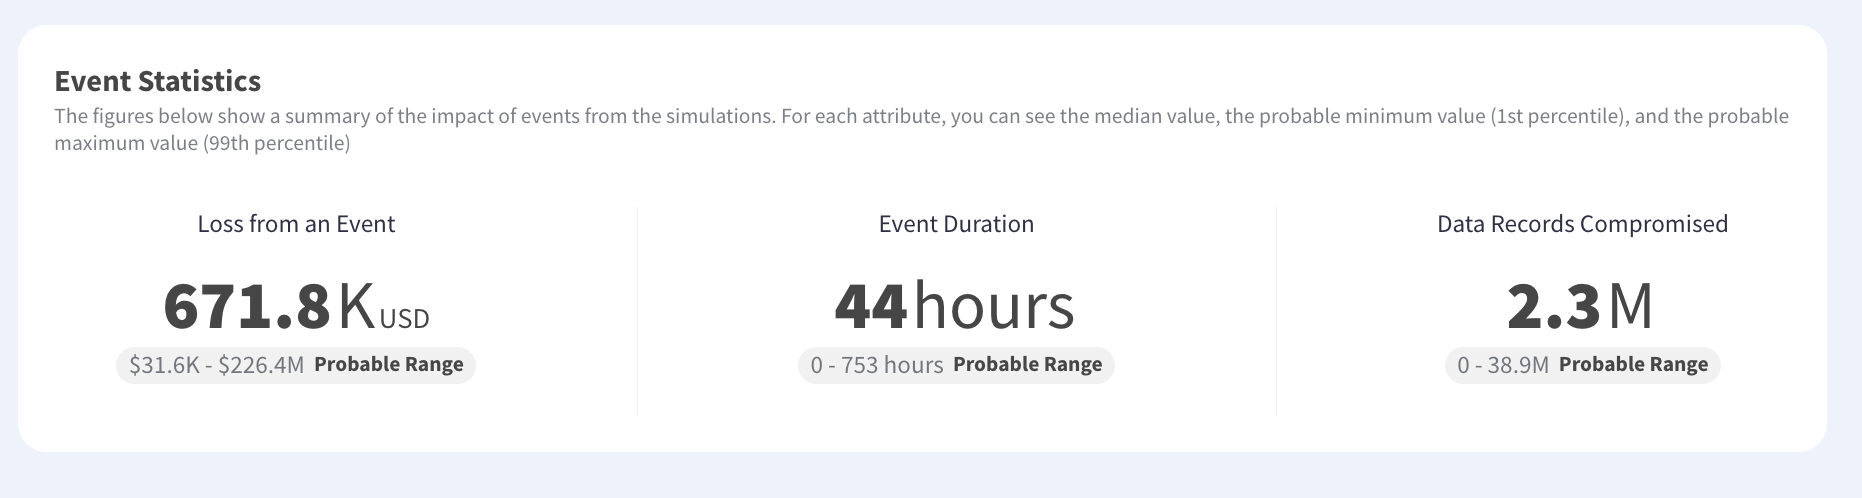
There is no trend, because a trend needs at least two comparable assessments and a young company has one. There is no demonstrated response capability, since recovery has never been tested at the scale a scenario assumes. Asset values are unstable, as revenue and data volumes may double inside the assessment period. The peer set is also thin where the company operates in a category that did not exist recently.
Which of Those Is the Real Constraint?
Asset volatility, because it hits severity and severity dominates the extreme figure. A company whose revenue triples during a year has a figure that was correct when produced and describes a materially smaller business than the one now operating, and a figure that moves in steps behaves exactly this way when the underlying business is growing quickly.
How Should Growth Be Handled?
Model the position at a stated point and re-deriving on business change rather than on a calendar, which is the opposite of how established companies usually run it.
A mature organization can reasonably assess annually because its asset base moves slowly. A company growing quickly needs a re-derivation when revenue, headcount or data volume crosses a threshold, since those are the inputs driving the answer. Tying the exercise to a funding round, a major customer or a new market is more useful than tying it to a quarter.
What Should Be Reported in the Meantime?
The figure with its basis date and the growth assumption stated explicitly. A number described as current exposure at present revenue is checkable. One presented without that qualification will be read as a standing position and quoted six months later against a business twice the size.
What Do the People Asking Want?
Not an incident history, which is the useful thing to establish before assembling one. Each of the three audiences is asking for something a young company can produce.
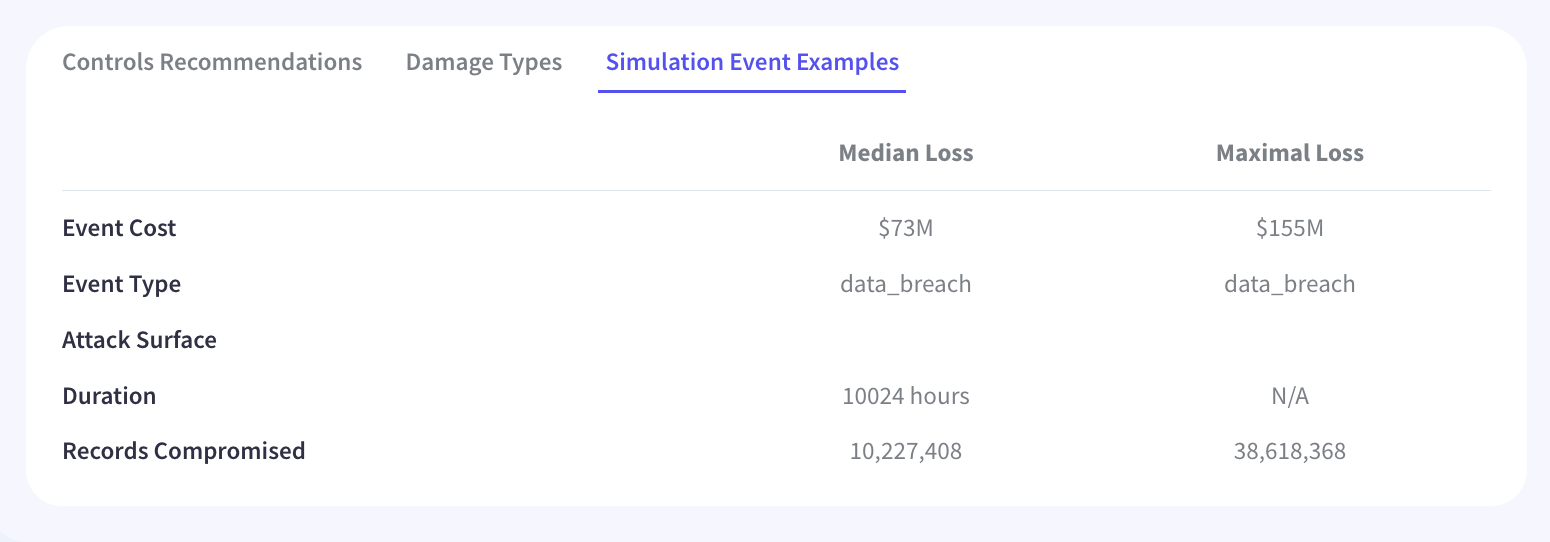
An underwriter wants control evidence and an exposure figure, because the frequency term comes from their own book rather than from your past. An enterprise customer wants a certification, answers to a questionnaire and evidence that controls operate. A board wants the exposure against appetite and the direction of travel. A clean incident record is a positive in all three conversations and an absent one is not a disqualification.
Which Question Is Hardest to Answer?
Direction of travel, since it is the one requiring a series. The workable substitute is reporting control implementation over time instead, because that does accumulate from the first assessment and it is the input a later exposure trend will reflect anyway, which choosing the right indicator addresses directly.
Where Should the Frequency Inputs Come From?
Three sources in descending order of strength, and stating which one carried a given estimate is what makes the result defensible.
- Industry loss data: Large populations of observed events, adjusted for sector and size, which is the same basis an established company uses.
- Public threat reporting: Freely available breach investigation reports and exploited vulnerability catalogues, which indicate what targets organizations of a given profile.
- Control implementation as a proxy: Where a fundamental control is absent, the susceptibility term moves toward certainty rather than toward an average.
Calibrated expert estimation completes the set and belongs last. Trained range estimates from engineering leads are usable and they are judgment presented in the same notation as observed data, so labeling which inputs came from where matters more than the estimate itself, which comparing two defensible methods examines in more detail.
How Wide Should the Range Be?
Wider than an established company's, and saying so is the difference between a credible figure and an overconfident one.
A young company has volatile asset values, an untested response capability and a thin peer set, and each of those widens the interval legitimately. Reporting a range and naming which input drives its width is more useful than reporting a midpoint, because it tells the reader what would need to change for the figure to tighten. A narrow range from a company with none of the supporting stability is the result to distrust.
Does a Wide Range Still Support Decisions?
For most of them, yes. A retention decision, a limit decision or a control investment usually turns on whether the exposure is in the millions or the tens of millions rather than on a precise figure, and a wide range frequently answers that without ambiguity. Where a decision genuinely requires precision the range cannot supply, that is worth knowing before the decision is made.
What About the Peer Comparison?
Available on severity and unreliable on frequency, which is the same split that applies to any peer benchmarking exercise and matters more here because the temptation to lean on peers is stronger.
Structural peers by revenue, sector, data volume and regulatory footprint determine what a failure costs, and those are comparable regardless of company age. Peers matched on maturity or on how long they have operated are a different and weaker basis, since a company's age tells you little about its control position. Choosing the comparison on structure rather than on stage is what makes the comparison hold, and peer benchmarking sets out the wider version.
What If There Are No Structural Peers?
Decompose to components that do have them. A company in a genuinely new category still holds customer records, still depends on cloud infrastructure and still has revenue that stops if systems stop. Each of those has comparators even where the business as a whole does not, and building severity from the components rather than from the category is the workable route.
Which Comparison Should Never Be Made?
Against a published average for an industry. An average conceals the distribution it came from, and a company well below median on data volume and well above on regulatory exposure resembles the average in no useful respect. The components are comparable and the aggregate rarely is.
What Can Be Produced in Two Weeks?
A defensible first figure, provided the scope is narrow and the assumptions are written down.
Take the three scenarios most likely to matter for the business rather than a comprehensive library. Value them from current asset data with the growth assumption stated. Draw frequency from industry data adjusted by an honest control assessment. Report a range with the driving assumption named and the basis date attached. Then set a re-derivation trigger on business change. Cyber risk quantification, or CRQ, does not require a history to start, and the first figure is what makes the second one comparable.
Nobody Uses Their Own History
The objection that quantification needs a baseline misreads where frequency comes from, since even a long-established organization has too few of its own events to estimate a rate and every credible model draws on industry loss data instead. What a young company genuinely lacks is a trend, a tested response capability, stable asset values and a thick peer set, and of those the asset volatility matters most because severity drives the extreme figure. Reporting a range with the basis date and the growth assumption attached, and re-deriving on business change rather than on a calendar, produces something an underwriter, a customer and a board can all use. Kovrr's CRQ models draw frequency from industry loss data and severity from your own position, which is the same basis at any age.
To see a first exposure figure built from industry loss data and your current control position, book a demo with our cyber risk experts.

No History Quantification FAQs
Speak to an ExpertDoes cyber risk quantification need your own incident history?

What does a young company's own data contribute?
What is genuinely harder without a history?
How should rapid growth be handled?
What do underwriters and customers ask for?
How wide should the reported range be?