
Blog Post
A Risk Number Does Not Decay on a Smooth Curve
September 1, 2026
An annual quantification gets produced in March and quoted as fact in November. Everyone involved knows the figure has aged and nobody knows by how much, so it keeps being presented with the same confidence it had on the day it was signed off.
The usual framing is that a number decays gradually and needs refreshing more often. The framing is half right and it misleads on the part that matters, because most of the decay does not happen gradually at all.
Does a Risk Figure Decay Smoothly?
No. It holds steady for long stretches and then moves in a step when something specific happens.
Between events, the underlying reality barely moves. Asset values drift, a few controls improve, some vulnerabilities get patched and others appear, and the aggregate figure would land close to where it was. Then an acquisition completes, a workload migrates, a critical vendor is onboarded, or a major control program finishes, and the correct figure changes materially in a week.
Why Does That Matter for Refresh Cadence?
Because a calendar cadence and a step function interact badly. A quarterly refresh performed two weeks before an acquisition produces a figure that is fresh, accurate and wrong by the following month. A refresh performed two weeks after captures it. The same cadence gives opposite results depending on where the events fall, so frequency alone does not solve staleness.
How Old Is the Number in Front of You?
The question has no single answer, and that is the more useful observation. A quantified figure is a composite of inputs with different ages, so parts of it may be days old while other parts are years old.
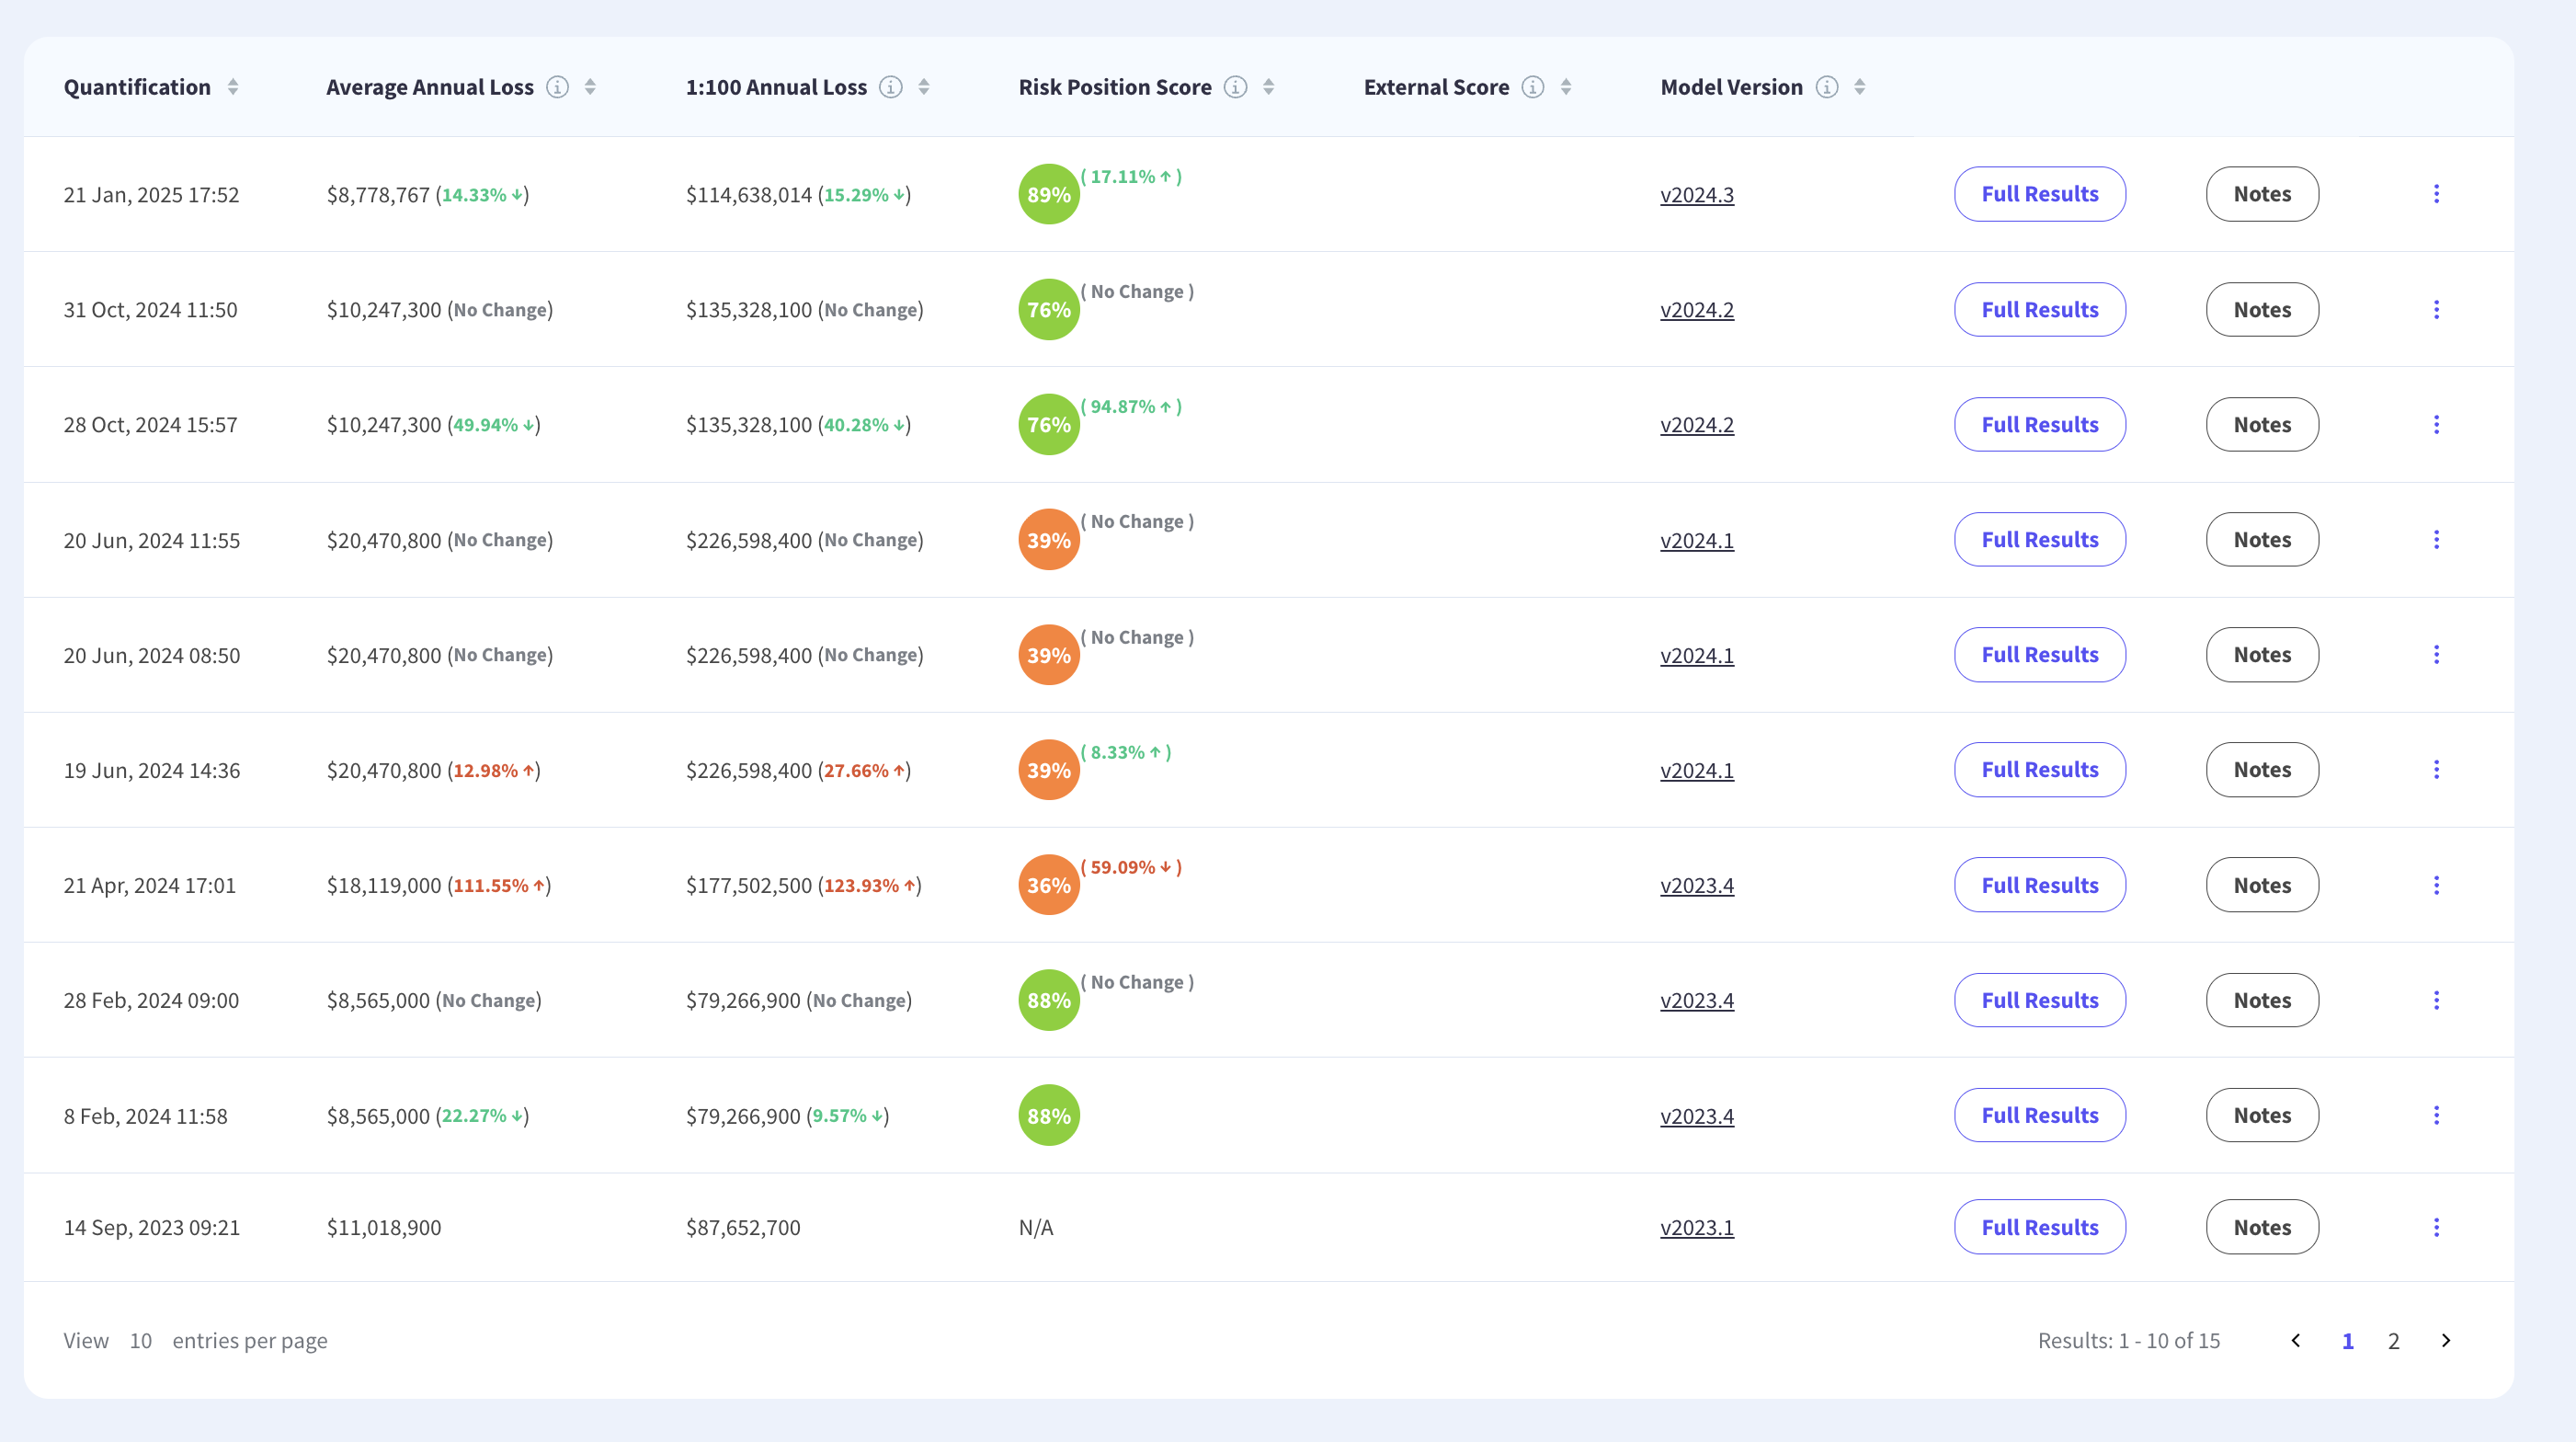
Control state might come from a scan last week. Asset values from finance data compiled at the last year end. Threat frequency assumptions from a model calibrated across a longer window. Business interruption costs from a continuity analysis somebody ran three years ago. Presenting all of that as a March figure is accurate about when the arithmetic ran and misleading about what went into it.
What Should Be Recorded Alongside the Figure?
The date of the oldest input rather than the date of the calculation. A number described as current because it was computed last week, resting on asset values from two years ago, is stale in the component that usually matters most for severity. Recording input vintages individually costs nothing and changes how the output gets read.
Which Inputs Decay Fastest?
They fall into roughly three bands, and knowing which band an input sits in tells you how often it needs attention.
Fast-moving inputs change in days to weeks, covering vulnerability state, patch position and control configuration, all of which drift continuously as systems change. Medium inputs move over one to three months, covering threat activity patterns and the effectiveness of controls as they are bypassed or reconfigured. Slow inputs move over quarters or years, covering asset values, business dependencies and the structure of the estate, and these are the ones that move in steps rather than continuously.
Which Band Drives the Figure?
Usually the slow one, which is the opposite of where attention goes. Choosing the right indicator has the same shape. Severity is determined by what the business would lose, and that comes from the slow-moving inputs. Frequency is affected by the fast ones. Since severity typically dominates an extreme loss figure, a program refreshing vulnerability data weekly while carrying three-year-old asset values is updating the term that matters least.
Can Refreshing More Often Make Things Worse?
Yes, and this is the trap in the standard advice. Frequent refreshes without version discipline produce movement that nobody can attribute.
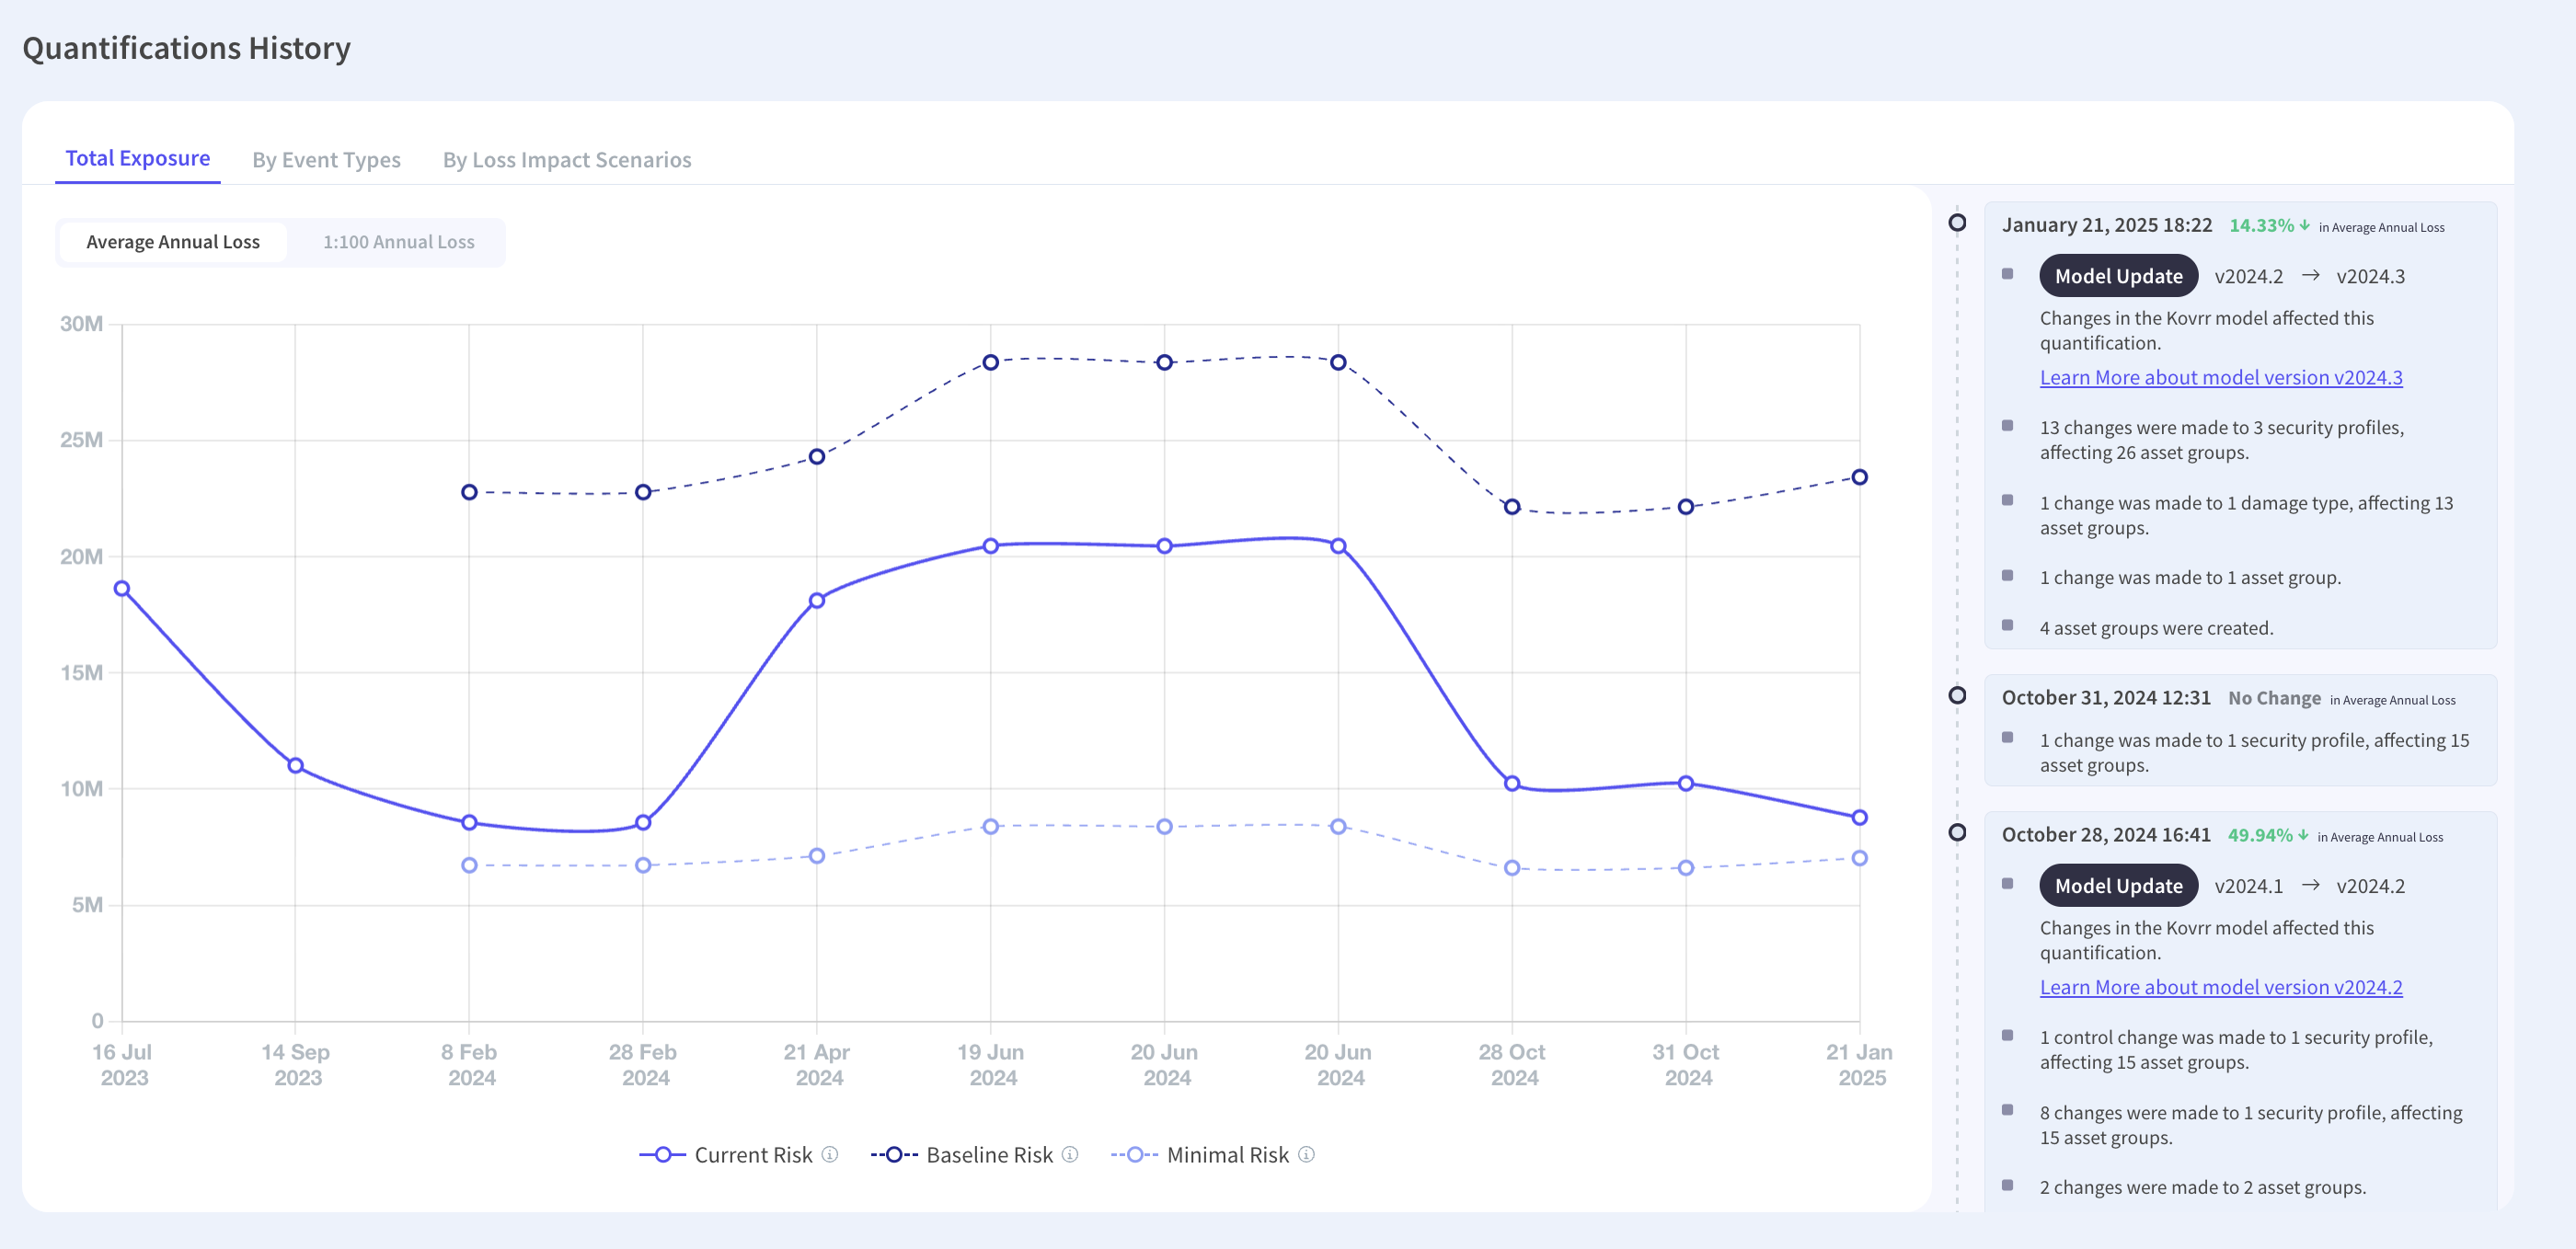
If a quarterly figure falls by fifteen percent, the board will ask what improved. The answer might be that controls improved, or that the model was recalibrated, or that a scenario was removed, or some combination nobody separated. A series with undocumented methodology changes is not a trend, it is a sequence of unrelated numbers, and increasing the frequency increases the number of unexplained movements.
How Do You Keep the Series Readable?
Record the model version against every figure and reporting methodology changes separately from environment changes. Where both moved in a period, state each contribution rather than the net. The discipline is what makes a comparison between periods informative at all, and its absence is why many programs cannot demonstrate improvement even when it occurred, which performance measurement depends on entirely.
What Should Trigger a Re-Run?
Events rather than dates, since the events are what move the number. Six are worth wiring as triggers.
- Structural Change: An acquisition, divestment, or a business unit entering or leaving scope.
- Infrastructure Change: A cloud migration, a data center consolidation, or a move to a shared identity platform.
- Dependency Change: A new critical vendor, or an existing one taking on more of a critical process.
The remaining three are a completed control program, a material incident whether internal or at a close peer, and a change in the regulatory position that alters penalty exposure. Each of those moves a specific input rather than requiring a full re-derivation, so the response is proportionate, and continuous monitoring already generates the signal for several of them.
Do Triggers Replace the Calendar?
They supplement it. A periodic full re-derivation remains worthwhile, because slow drift accumulates even without discrete events and because a fixed point in the year gives the series a comparable anchor. The calendar handles drift and the triggers handle steps, and a program running only one of the two misses whichever kind of change the other catches.
Which Direction Does a Stale Figure Usually Err In?
Understated, more often than not, and the reason is structural rather than accidental.
Estates grow. New systems are added, dependencies accumulate, data volumes rise and vendor relationships multiply, all of which increase exposure. Controls improve too, but improvement is deliberate and slow while growth is continuous and unmanaged. A figure carrying last year's estate against this year's controls therefore tends to understate what is at stake more often than it overstates what is defended.
Does That Apply to Every Component?
No, and the exception is worth naming. Where a significant control program completed since the assessment, the stale figure overstates exposure and the organization is under-reporting its own improvement. Programs in that position frequently discover it only when somebody asks why the number has not moved, which is an argument for triggering a re-run on completed remediation as well as on adverse events.
How Does This Affect an Insurance Renewal?
Directly, since a submission built on a stale figure misrepresents the position in whichever direction the staleness runs. An understated exposure invites limits sized too low. An overstated one invites premium the organization did not need to pay, and what an underwriter reads differs from what a board reads, so the same stale figure causes different problems in each conversation.
What Should a Board Ask About the Age of a Figure?
Three questions, and the third is more useful than the first two combined.
What is the oldest input in this number, which surfaces the composite problem. What has changed since it was produced, which is answerable from a trigger list and converts an abstract concern into a specific one. Third, whether any decision in front of the board would change if the figure were materially different, say by thirty percent in either direction.
Why Is the Third Question the Important One?
Because it converts staleness from a data quality complaint into a decision question. Where no decision flips at plus or minus thirty percent, the age of the figure is not urgent regardless of how old it is. Where one does flip, the staleness matters immediately and the refresh is worth commissioning that week. Most precision anxiety in board reporting is misplaced for exactly this reason, and reporting exposure to directors is more useful when it states which decisions the figure supports.
What Does a Workable Cadence Look Like?
Three tiers, matched to how fast each input moves rather than applied uniformly.
Continuously updated inputs come from systems already running, covering control state, asset discovery and vulnerability position, and they feed the model without anyone commissioning anything. Periodically refreshed inputs are reviewed quarterly, covering threat assumptions and control effectiveness ratings. Slowly changing inputs are re-derived annually, covering asset values, business interruption costs and dependency structure, with the trigger list catching anything that moves in between.
What Does That Change in Practice?
The full exercise happens once a year and the number stays current between times, because the volatile inputs update against a frozen model rather than requiring a fresh derivation. It also separates the two kinds of change by construction, since methodology only moves at the annual re-derivation while the environment moves continuously.
What Should You Do This Quarter?
Three steps, and the first takes an afternoon.
Record the vintage of each major input behind your current figure, then identify the oldest one. Write the trigger list and assign somebody to be told when those events occur, which is usually a question of subscribing to changes other functions already announce rather than building anything. Then check whether the model version is recorded against your last several assessments, since without it the series cannot be read and the work of producing it is largely wasted.
Who Should Own the Trigger List?
Whoever owns the model, since they are the only ones who know which inputs each event disturbs. Assigning it to a business function produces notifications nobody can act on, and assigning it to nobody produces the current situation, where the events happen and the figure does not move because the next scheduled refresh is months away.
Does Any of This Require New Tooling?
Not for the first two steps. Input vintages are a matter of recording what you already know, and the trigger list is a subscription to announcements other parts of the organization already make. The third step depends on whether your platform records model versions, and if it does not, that is worth establishing before the next assessment rather than after.
Report the Vintage, Not Just the Value
A quantified figure does not decay on a smooth curve. It holds while nothing structural happens and moves in steps when something does, which is why refresh frequency alone does not fix staleness and why a trigger list belongs alongside the calendar. The figure is also a composite with no single age, so the honest disclosure is the vintage of its oldest input rather than the date of the calculation. Refreshing more often without recording model versions also produces movement nobody can attribute, which is worse than a stale number plainly labeled. Kovrr's cyber risk quantification records the model version and date against every run, so a series can be read as a trend rather than as a sequence.
To see exposure tracked across assessments with the methodology recorded against each run, book a demo with our cyber risk experts.

Risk Number Decay FAQs
Speak to an ExpertDoes a cyber risk figure decay gradually?

How old is a quantified figure?
Which inputs decay fastest, and which matter most?
Can refreshing more often make things worse?
What events should trigger a re-run?
What should a board ask about the age of a figure?