
Blog Post
Same Numbers, Two Audiences: Insurer and Board
August 25, 2026
The same quantification run supports two conversations that happen weeks apart. One with a board asking whether the organization is managing cyber risk sensibly. One with an underwriter deciding what to charge for it.
Most guidance treats these as a formatting problem, where the board version gets charts and the submission gets detail. The more useful observation is that the two readers want opposite things from the same figure, and one of the two documents carries contractual consequences the other does not.
The Interests Are Not Aligned
A board reads an exposure figure as a measure of whether the risk is understood and proportionate. A high number can support a budget request. A number that moved in the right direction is evidence the program works.
An underwriter reads the same figure as an input to pricing. A high number is a reason to charge more, attach higher or restrict coverage. Nothing about that is adversarial, and it does mean the incentive to present the number generously runs in opposite directions depending on the room.
The Distortion Shows Up in the Artifacts
Organizations under pressure resolve this by producing two figures. The board pack carries the larger exposure supporting an investment case, and the submission carries a more conservative reading. Both are defensible in isolation and the pair is not, since a claims process can request both. Coverage failures frequently trace back to something stated at submission.
A Submission Is a Representation
This is the asymmetry that matters most and it is routinely missed by teams who have only ever reported internally.
.png)
A board report is internal governance. An inaccurate statement in one is a management problem, correctable at the next meeting. An underwriting submission is a document the insurer relies on when pricing and binding, and a material misstatement can affect whether a claim is paid.
The difference should change who reviews the document and how carefully. Statements about control coverage deserve particular attention, since a claim reading multi-factor authentication as fully deployed against an environment where several legacy systems are excepted is exactly the kind of discrepancy that surfaces at the worst moment. Precise scoping language costs nothing at submission and a great deal later.
What Each Reader Is Looking For
Beneath the format difference the two audiences want structurally different things from the same underlying analysis.
Underwriters Read Controls as Evidence
The submission side turns on demonstrable operational facts. Coverage of endpoint detection stated as a percentage rather than as deployed. Backup immutability and the date restoration was last tested. Patch timelines for critical vulnerabilities expressed as measured performance rather than policy. Whether an incident response plan has been exercised and when, and whether forensic support is retained in advance. Each is a fact with a date attached rather than an assessment.
Boards Read Position and Direction
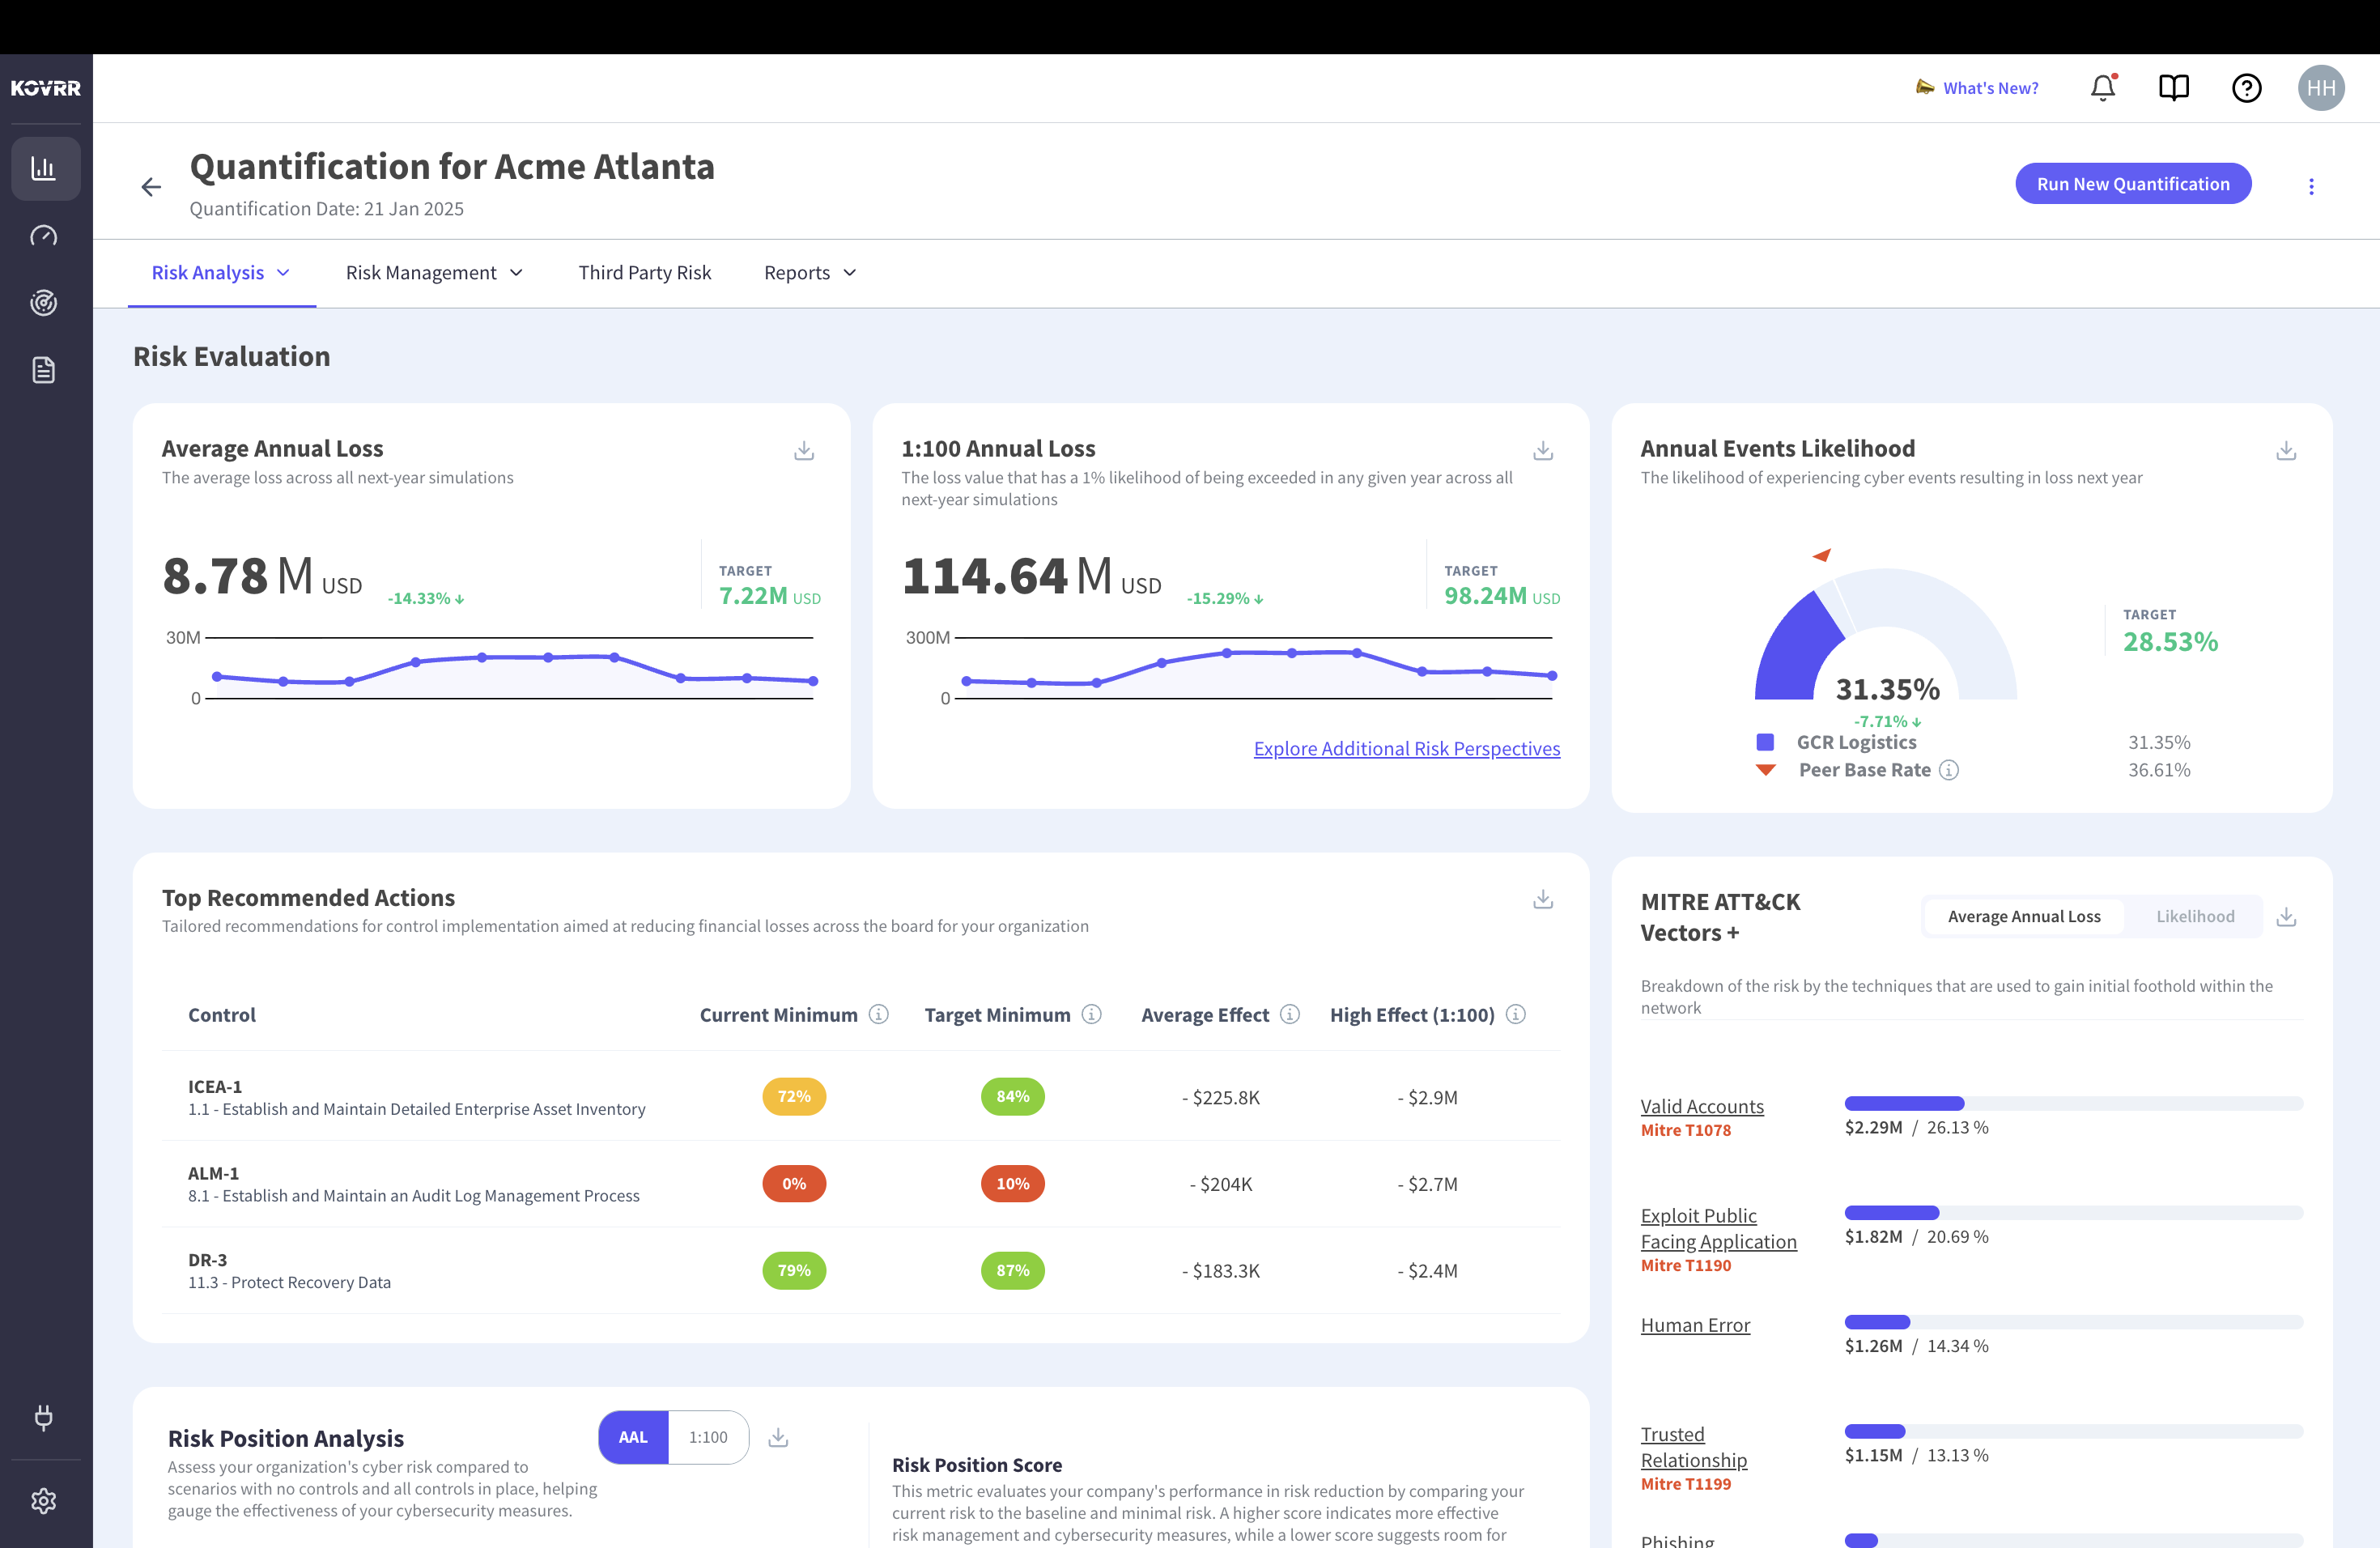
Directors are asking a different question, which is whether the exposure sits inside what the organization has agreed to carry and whether it is moving. A single figure invites the reasonable response of asking whether it is good. The same figure alongside a stated threshold, a prior period and a peer base rate answers a question they can act on, which is what quantified board reporting has to deliver.
Where the Two Should Agree
The presentation differs legitimately. The model underneath should not, and divergence between the two is a governance failure rather than a communications choice.
- One Model Version: Both documents should cite the same run and the same version, so any difference is presentational rather than substantive.
- Consistent Control Statements: What the board is told about coverage and what the insurer is told should reconcile line by line.
- Same Scenario Set: A scenario material enough for a board is material enough to disclose, and omitting it from one is a decision somebody should own.
Keeping the underlying analysis identical also removes a recurring inefficiency, since most of the preparation effort for the two documents overlaps entirely and gets duplicated because different people own them. Where the register holds the scenarios and the figures, both documents draw from one place.
What the Submission Can Do That a Questionnaire Cannot
Standard proposal forms ask closed questions about control presence, which flattens a well-run program and a barely adequate one into the same answers. A quantified submission supplements that with something the form has no field for.
Modeled exposure by coverage line indicates whether the limits being sought are sized to the distribution rather than to last year's renewal. Return period figures speak the language underwriting already uses. Control effectiveness expressed as loss reduction demonstrates that investment produced an outcome rather than an expenditure. Organizations presenting this material generally find the conversation moves from establishing insurability to discussing structure, and negotiating on modeled figures covers what that changes.
Sub-Limits Are Where the Analysis Earns Its Keep
An aggregate limit can look adequate while individual coverage lines are undersized, and that only becomes visible with exposure modeled per line. Business interruption and contingent business interruption are the usual culprits, and both are easier to argue for at renewal with a figure than with a concern, which is what testing whether coverage is correctly sized establishes.
Prepare Once, Present Twice
Four artifacts serve both audiences with different emphasis, which is a considerably better arrangement than two parallel efforts.
A current exposure figure with its model version and date. A control statement with coverage percentages and last-tested dates rather than binary answers. A scenario set with the largest contributors named. A movement record showing the previous period alongside the current one completes it. The board pack leads with position and direction and treats controls as supporting detail. The submission leads with control evidence and treats exposure as context. Same material, reordered.
Review the Submission Like a Contract
Whoever reviews board materials is usually not the right reviewer for a document that affects coverage. Adding legal or risk transfer review to the submission process, specifically checking that control statements are scoped accurately, is a small step that addresses the asymmetry these two documents carry.
Same Analysis, Different Stakes
The board and the underwriter are reading the same model for different purposes, and the incentives around the headline figure point in opposite directions. Keeping the analysis identical while reordering the presentation resolves that cleanly, and remembering that only one of the two documents is relied upon contractually determines how carefully each should be reviewed. Kovrr's cyber insurance coverage optimization models exposure per coverage line, which is the view that serves a renewal conversation and a board discussion from one place.
To see modeled exposure mapped against your current program and its sub-limits, book a demo with our risk experts.

Insurer and Board Reporting FAQs
Speak to an ExpertHow should a board report differ from an insurance submission?

Why do the two audiences want different things from the same figure?
What makes an underwriting submission different from internal reporting?
What do underwriters look for specifically?
What does quantification add to a standard proposal form?
How do you avoid preparing two separate packages?