Blog Post
How to Quantify Cyber Risk for Board-Level Reporting
July 29, 2026
Quantifying cyber risk for the board means translating technical exposure into dollar-denominated financial risk that the audit committee, CFO, and directors can act on. Boards care about strategic business impact like operational downtime, regulatory penalties, and reputational damage.
They do not care about patch rates, blocked emails, or firewall logs, which are the metrics cyber teams have historically brought to board meetings and which board members have historically ignored. The difference between a board deck that drives real decisions and one that generates polite nods is whether the numbers on the slides speak the language of finance or the language of IT.
This article covers what boards want to see, the four metrics every board-level cyber risk report should include, the cyber risk quantification (CRQ) playbook that produces them, how to present the numbers, what to look for in a CRQ platform built for board reporting, and the common mistakes that turn a strong quantification program into a weak board conversation.
What Boards Want to Know About Cyber Risk
Board conversations about cyber have changed materially over the past decade. The expanding role of the CEO, CFO, and board in cyber risk management has moved the topic from a technical update tucked into the audit committee agenda to a recurring line item on the full board agenda.
Why Traditional Cyber Metrics Fail at the Board Level
Operational metrics like mean time to detect, patch rates, and vulnerability counts belong on the CISO's dashboard, not the board's. They measure the security team's work, not the business exposure the board is responsible for. When a director asks "how much cyber risk are we carrying," a patch rate is not an answer. When they ask "what did last quarter's investment produce," a count of blocked emails does not tell them.
Every metric that stays inside the security function's operating language leaves the board without the data it needs to fulfill its fiduciary responsibility, which is why the cybersecurity metrics that matter most in the boardroom look different from the metrics inside the SOC.
The Strategic Questions Boards Ask
Boards want answers to four recurring questions.
- How much cyber risk is the organization carrying, in dollar terms comparable to other enterprise risks?
- How has that number moved quarter over quarter, and what drove the movement?
- Which specific investments produced the movement, and what is the return on each dollar spent?
- How does our exposure compare to peers in the same industry and size band?
A board report that answers those four questions creates a real conversation. Anything else generates a polite nod and moves the meeting along.
The Four Metrics That Matter Most in the Boardroom
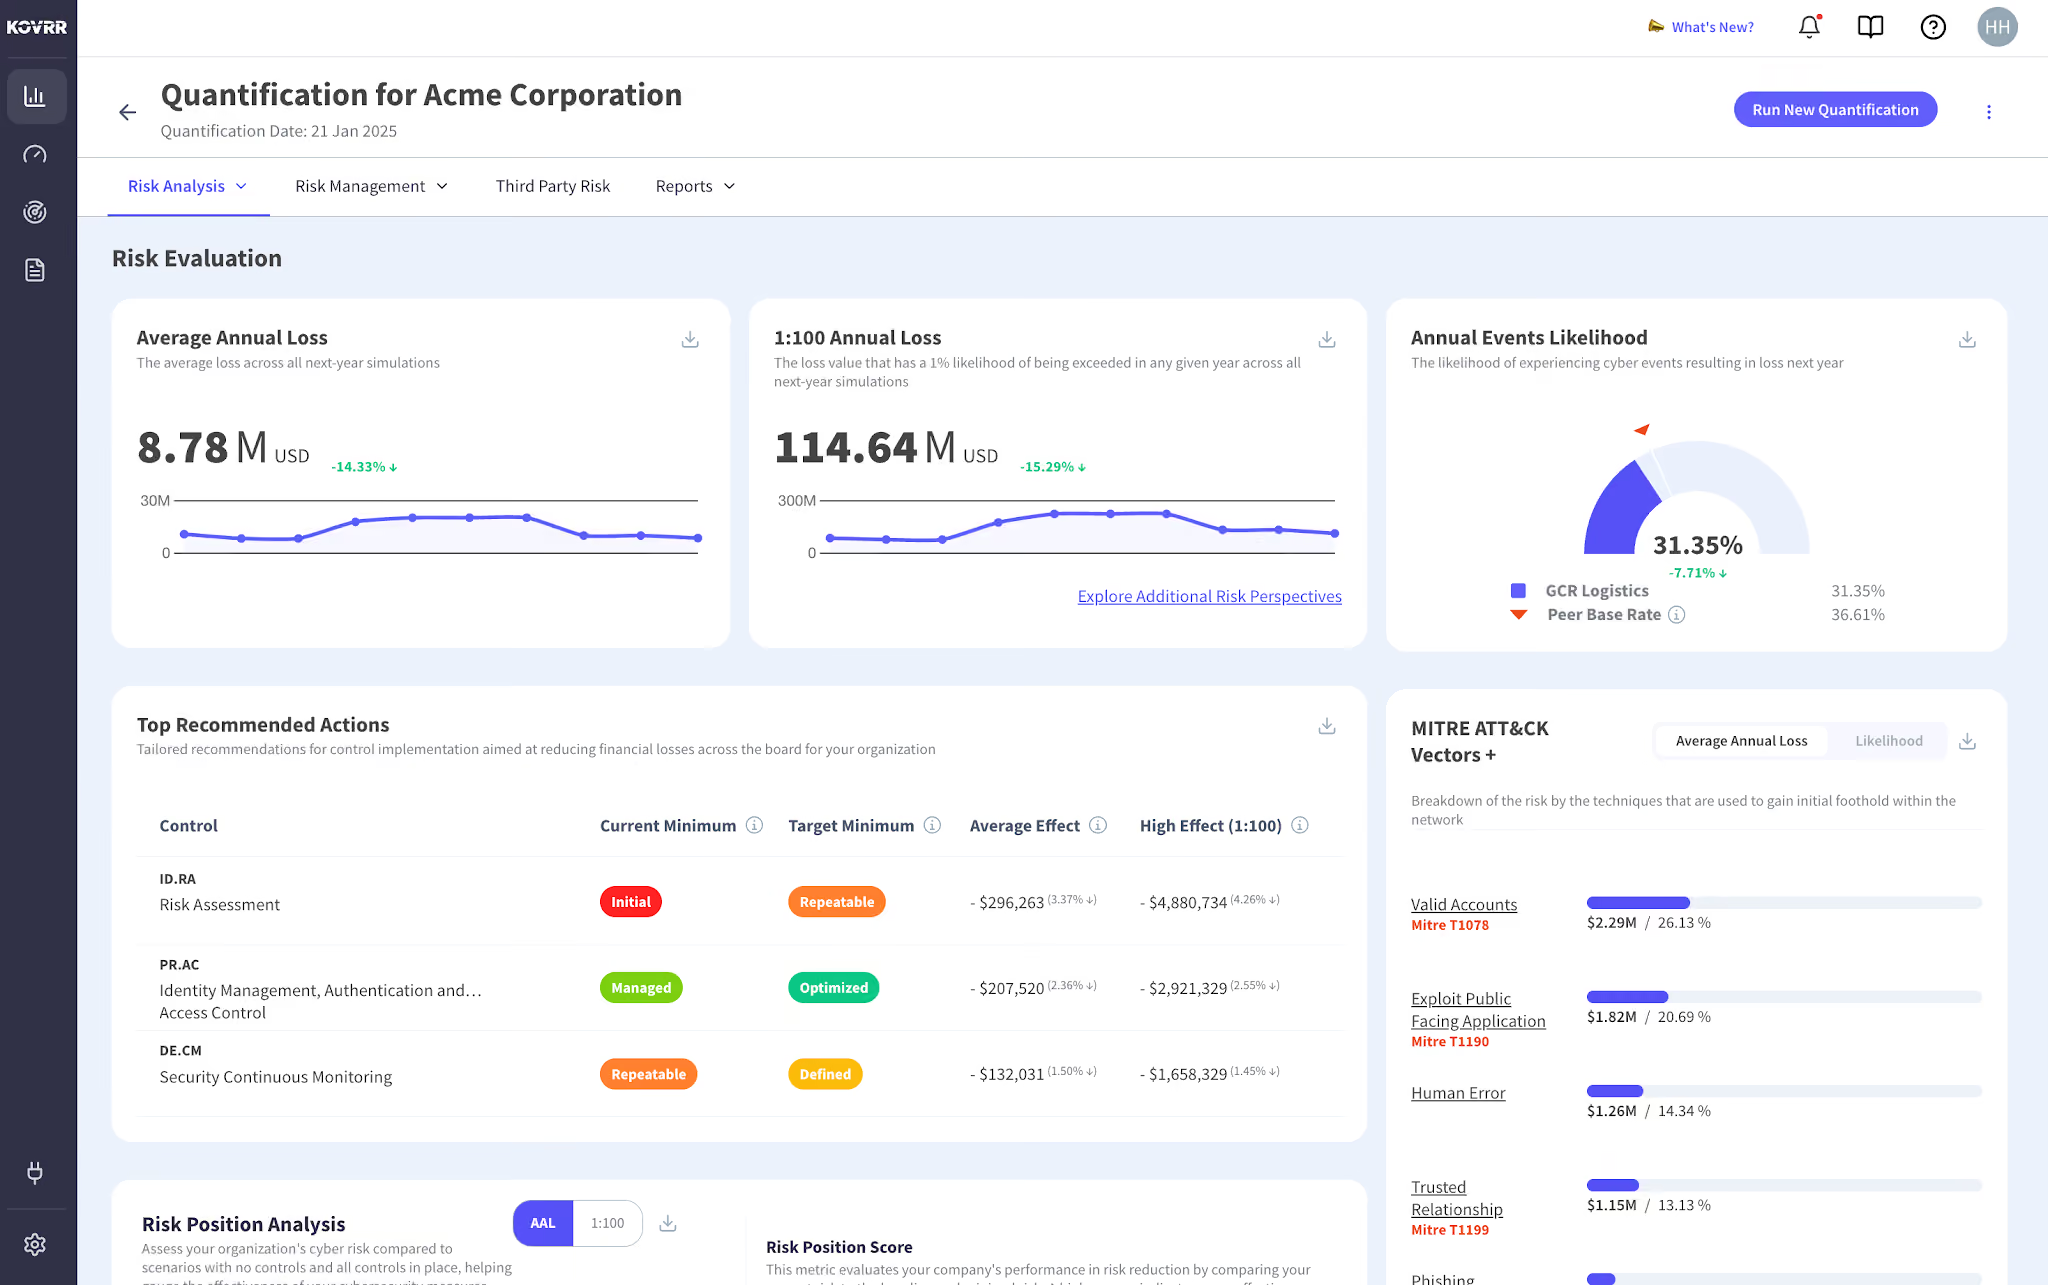
The strongest board-level cyber risk reports rest on a small number of financial metrics that connect directly to how the board already thinks about enterprise risk.
Financial Exposure Metrics
- Average Annual Loss (AAL): The expected annualized cyber exposure representing the predictable baseline financial impact the organization carries.
- 1-in-100 Worst-Case Loss: The maximum probable loss at the 99th percentile confidence interval, which anchors tail-risk and cyber insurance conversations.
- Loss Exceedance Curve: The full probability distribution of potential annual losses, which lets the board see the annual probability of exceeding any dollar threshold, explained in depth in deciphering the Loss Exceedance Curve (LEC).
Investment and Tolerance Metrics
- Return on Security Investment (ROSI): The financial risk reduced per dollar spent on each proposed control initiative, tied to budget justification.
- Risk vs. tolerance thresholds: A visual indicator showing where current exposure exceeds the board's defined risk appetite, so directors know which numbers demand attention.
- Quarter-over-quarter movement: The direction and magnitude of change in AAL and tail exposure across reporting periods, so the board sees whether the program is trending in the right direction.
The Board-Level CRQ Playbook
Building a board-ready quantification program requires four disciplines executed together. Skipping any of them produces numbers the board will not trust when scrutinized.
Adopt a Standardized Economic Model
Use established financial modeling techniques rather than inventing an internal risk math system. Monte Carlo simulation runs thousands of trials against calibrated frequency and severity distributions to produce full loss distributions. Kovrr's engine runs 25,000 trials per quantification, which is what gives the output statistical significance rather than the appearance of it. Anchoring the model to actuarial-grade data drawn from insurance claims history is what makes the numbers defensible when the CFO asks where they came from.
Map Assets by Business Criticality
Boards care about the systems that drive revenue and customer trust. Inventory on-premises servers, cloud instances, and third-party vendor platforms, then classify each system by the business value it supports rather than by its IT replacement cost. A breach of a customer-facing portal produces materially different exposure than an isolated internal system, and the model needs to weight losses accordingly for the numbers to hold up under scrutiny.
Model High-Impact Threat Scenarios
Combine threats, assets, and controls into distinct, probabilistic scenarios rather than reporting individual vulnerabilities. Focus on the small number of scenarios that carry the highest financial exposure: ransomware against core infrastructure, third-party service provider failure, data exfiltration from customer-facing systems. Each scenario should produce its own AAL and tail loss figure so the board can see where the total exposure comes from and which scenarios move the number most.
Track Movement Over Time
A single point-in-time snapshot tells the board almost nothing. Quarter-over-quarter movement is what shows whether investment decisions are working, and continuous quantification is what makes quarterly reporting meaningful. Programs that refresh their numbers only during board prep produce stale data that the board eventually stops trusting.
How to Present Cyber Risk to the Board
The playbook produces the numbers. Presentation is where those numbers either land or get lost. Two disciplines cover the presentation fundamentals, and the top strategies to demonstrate cybersecurity's value in the boardroom apply directly here.
What to Include on the Board Slide
- Financial exposure in dollar terms: Lead with AAL, tail loss, and the movement over time so the board sees the number first and the technical detail after.
- Peer benchmarks: Compare the organization's exposure to sector-matched peers so directors know whether the number is normal, high, or low for the industry.
- Investment ROI tied to specific initiatives: Show which controls produced which risk reduction, so budget conversations are grounded in evidence rather than opinion.
What to Leave Off the Board Slide
- Operational IT metrics: Patch rates, malware quarantines, and blocked emails belong on the SOC dashboard, not the board deck.
- Framework maturity scores in isolation: NIST CSF maturity ratings without a financial impact translation lose the board's attention fast.
- Qualitative color-coded ratings: High-medium-low labels and stoplight charts undermine the credibility of the financial numbers next to them.
For teams starting from scratch or looking to standardize how cyber gets presented across quarterly meetings, Kovrr's cybersecurity boardroom reporting template provides a ready-made structure covering all three "what to include" categories without the operational-metric traps.
What to Look For in a CRQ Platform for Board Reporting
Enterprise buyers evaluating CRQ platforms specifically for board reporting should focus on the capabilities that produce board-ready outputs continuously rather than as one-off exports.
Baseline Board-Reporting Capabilities
- Native AAL, tail exposure, and Loss Exceedance Curve views: The platform should produce the three headline metrics automatically rather than requiring downstream calculation.
- Quarter-over-quarter movement tracking: Historical quantification data should be preserved so directors see trend lines, not point estimates.
- Materiality mapping: Direct alignment to SEC disclosure materiality analysis so regulatory obligations get evaluated on the same data the board sees.
Advanced Differentiators
- Reports Hub for grouped board metrics: Purpose-built views that group CRQ metrics for effective communication rather than exporting raw data into slide templates.
- Continuous telemetry integration: The platform should ingest data from security tools, cloud environments, identity providers, and third-party sources continuously, so the numbers stay live between meetings.
- Peer benchmarking built in: Industry-matched peer exposure should surface automatically alongside internal numbers, eliminating the manual research required to answer directors' comparison questions.
Kovrr's Cybersecurity Board Report is built around these requirements, connecting continuous quantification, quarter-over-quarter tracking, peer benchmarks, and materiality mapping into a single view that gets refreshed every reporting cycle without additional analytical work.
Common Mistakes in Board-Level Cyber Risk Reporting
Failed board reports follow predictable patterns. Two categories cover most of the traps CISOs walk into.
Mistakes in What Gets Reported
- Leading with technical detail: Opening with vulnerability counts or maturity scores tells the board the report is not for them.
- Missing movement context: A single AAL figure without quarter-over-quarter comparison offers directors no way to evaluate program performance.
- No peer comparison: Reports without industry benchmarks force directors to guess whether the number is high, low, or in line with peers.
Mistakes in How the Report Is Delivered
- Overloading the deck: A 40-slide cyber deep-dive dilutes the numbers that matter. Directors want the AAL, the movement, the top scenarios, and the investment ROI on one slide each.
- Inconsistent metrics across reports: Changing the metrics or methodology between meetings destroys the trend view boards depend on to evaluate progress.
- No connection to enterprise risk: Presenting cyber in isolation from other enterprise risks makes it hard for the board to weigh trade-offs across the full risk portfolio.
The lessons from mega-breaches on cybersecurity board reporting reinforce every one of these points, since the boards that were caught off guard were the ones whose reports never surfaced the exposures that eventually materialized.
Making Cyber Risk Reporting a Board-Level Conversation
Board-level cyber risk reporting is where the entire quantification program either creates business value or gets treated as an internal security exercise. Reports that produce defensible dollar figures, track movement over time, benchmark against peers, and connect investment decisions to risk reduction give the board what it needs to fulfill its fiduciary responsibility. Reports that stay in technical language keep cyber trapped in the operational conversation and cede strategic influence to every other enterprise risk category that already reports in financial terms.
To see how Kovrr's Board Report and Reports Hub produce board-ready cyber risk views continuously from the underlying CRQ platform, book a demo tuned to your industry and control posture.

Quantifying Cyber Risk for Boards FAQs
Speak to an ExpertWhat is the difference between a cyber risk report and a cyber risk register at the board level?

How does quantified cyber risk reporting support SEC disclosure obligations?
How often should the board see cyber risk reports?
Which CRQ platforms are best for board reporting?
Which cyber risk metrics matter most to boards?
How do I quantify cyber risk for board-level reporting?