Blog Post
How Accurate Are CRQ Models? Understanding Statistical Significance
August 2, 2026
Cyber risk quantification (CRQ) models are as accurate as the data and methodology behind them, and the conversation about CRQ accuracy that plays out across security and finance teams is often stuck on the wrong question. Risk is about future events that may or may not happen, and if they do, the impact will vary.
Looking for certainty in a probabilistic model is a category error. The useful question is not whether a CRQ model produces the "right" number. The useful question is whether the model produces a defensible distribution of outcomes that helps leadership choose the least-worst option and optimize spending against loss potential.
This article covers what accuracy means for probabilistic models, the data and methodology inputs that drive real trustworthiness, what produces statistical significance in CRQ outputs, why two reasonable models can produce different numbers, what to look for when evaluating a cyber risk quantification vendor, and the questions every buyer should ask before signing.
How Accurate Are Cyber Risk Quantification Models?
CRQ models are designed to produce probability distributions of potential losses, not point predictions of what will happen. Accuracy for this class of model is measured differently from how accuracy gets measured for deterministic systems like scales or thermometers. A CRQ model that produced a single "correct" annual loss figure would be a poorly designed model, because the underlying phenomenon is inherently variable.
Why Accuracy in CRQ Means Decision Utility
A well-built CRQ model does three things well. It captures the range of plausible outcomes given the organization's threat exposure and control posture. It calibrates the frequency and severity of those outcomes against real-world data rather than internal history or expert opinion alone. And it produces outputs stable enough across reruns that decision-makers can trust the numbers to move for real reasons rather than random noise. When those three properties hold, the model is doing what a probabilistic model is designed to do. It supports the decision, even though it will never eliminate the uncertainty behind the decision.
The Weather Forecast Comparison
Two weather models can look at the same storm system, draw on different data sources and assumptions, and produce different forecasts. One might predict no snow. The other might predict eight inches. Both can be reasonable within the methodology each one uses. The person deciding whether to buy salt, wake up early to shovel, or accept being late for work does not need a certain answer. They need a defensible forecast that supports the decision they are already trying to make. CRQ works the same way. The move from qualitative to quantitative risk assessment is about improving decision quality under uncertainty, not eliminating uncertainty from a fundamentally uncertain domain.
What Drives CRQ Model Accuracy
Accuracy varies enormously across CRQ vendors because the underlying data and methodology vary enormously. Understanding what separates trustworthy models from surface-level ones is the difference between an investment that produces real decision leverage and one that produces a dashboard nobody trusts.
Data Quality as the Primary Determinant
The single biggest determinant of CRQ model accuracy is data quality. A model built on limited or internally sourced data produces forecasts that reflect the organization's own narrow history rather than the true range of outcomes across the threat landscape. Cyber incidents are relatively low-frequency events for any single enterprise, which means internal data is almost always insufficient to calibrate a serious model.
The strongest models draw on actuarial-grade claims data from the insurance industry, multi-source threat intelligence, and continuously updated control posture data, as Kovrr CEO, Yakir Golan, documented in How Accurate Are Cyber Risk Quantification Models?.
The Problem With Public Breach Disclosure Alone
Public breach data is a tempting shortcut because it is easily accessible, but it does not represent the true distribution of actual cyber losses. Many incidents are never disclosed, and those that are tend to be skewed toward the most severe or high-profile events. Building a model on this foundation introduces systematic bias, typically toward underestimating the frequency of moderate losses and overestimating the rarity of severe ones. The result looks like a rigorous model but produces numbers that lose credibility the first time they get compared against organization-specific loss experience.
Why Static Models Decay Quickly
A quantification that was accurate at the time of its last update may be significantly wrong six months later if it has not incorporated new threat intelligence or changes in the organization's control environment. Accuracy is something that has to be maintained continuously rather than certified once. Modern CRQ platforms integrate live telemetry from security tools, control monitoring systems, and threat feeds so the model reflects current conditions rather than a historical snapshot, which is the approach Kovrr uses in the continuous control monitoring integration with CRQ.
What Produces Statistical Significance in CRQ Outputs
Statistical significance in a CRQ model comes from three interlocking properties. Each contributes to the confidence a decision-maker can place in the output, and skipping any one of them undermines the whole result.
Simulation and Sample Size
- Monte Carlo simulation: Thousands of trials run against calibrated frequency and severity distributions produce a full distribution of possible annual losses rather than a point estimate.
- Sufficient trial count: Models running 100 or 1,000 trials produce rough approximations that shift meaningfully between reruns; models running tens of thousands of trials produce stable distributions the outputs converge to.
- Kovrr's 25,000 trials per quantification: Documented in the CRQ model update that increased statistical significance, producing outputs that hold up under repeated evaluation.
Calibration and Output Views
- Actuarial-grade inputs: Frequency and severity distributions anchored to real insurance claims data rather than expert estimates alone.
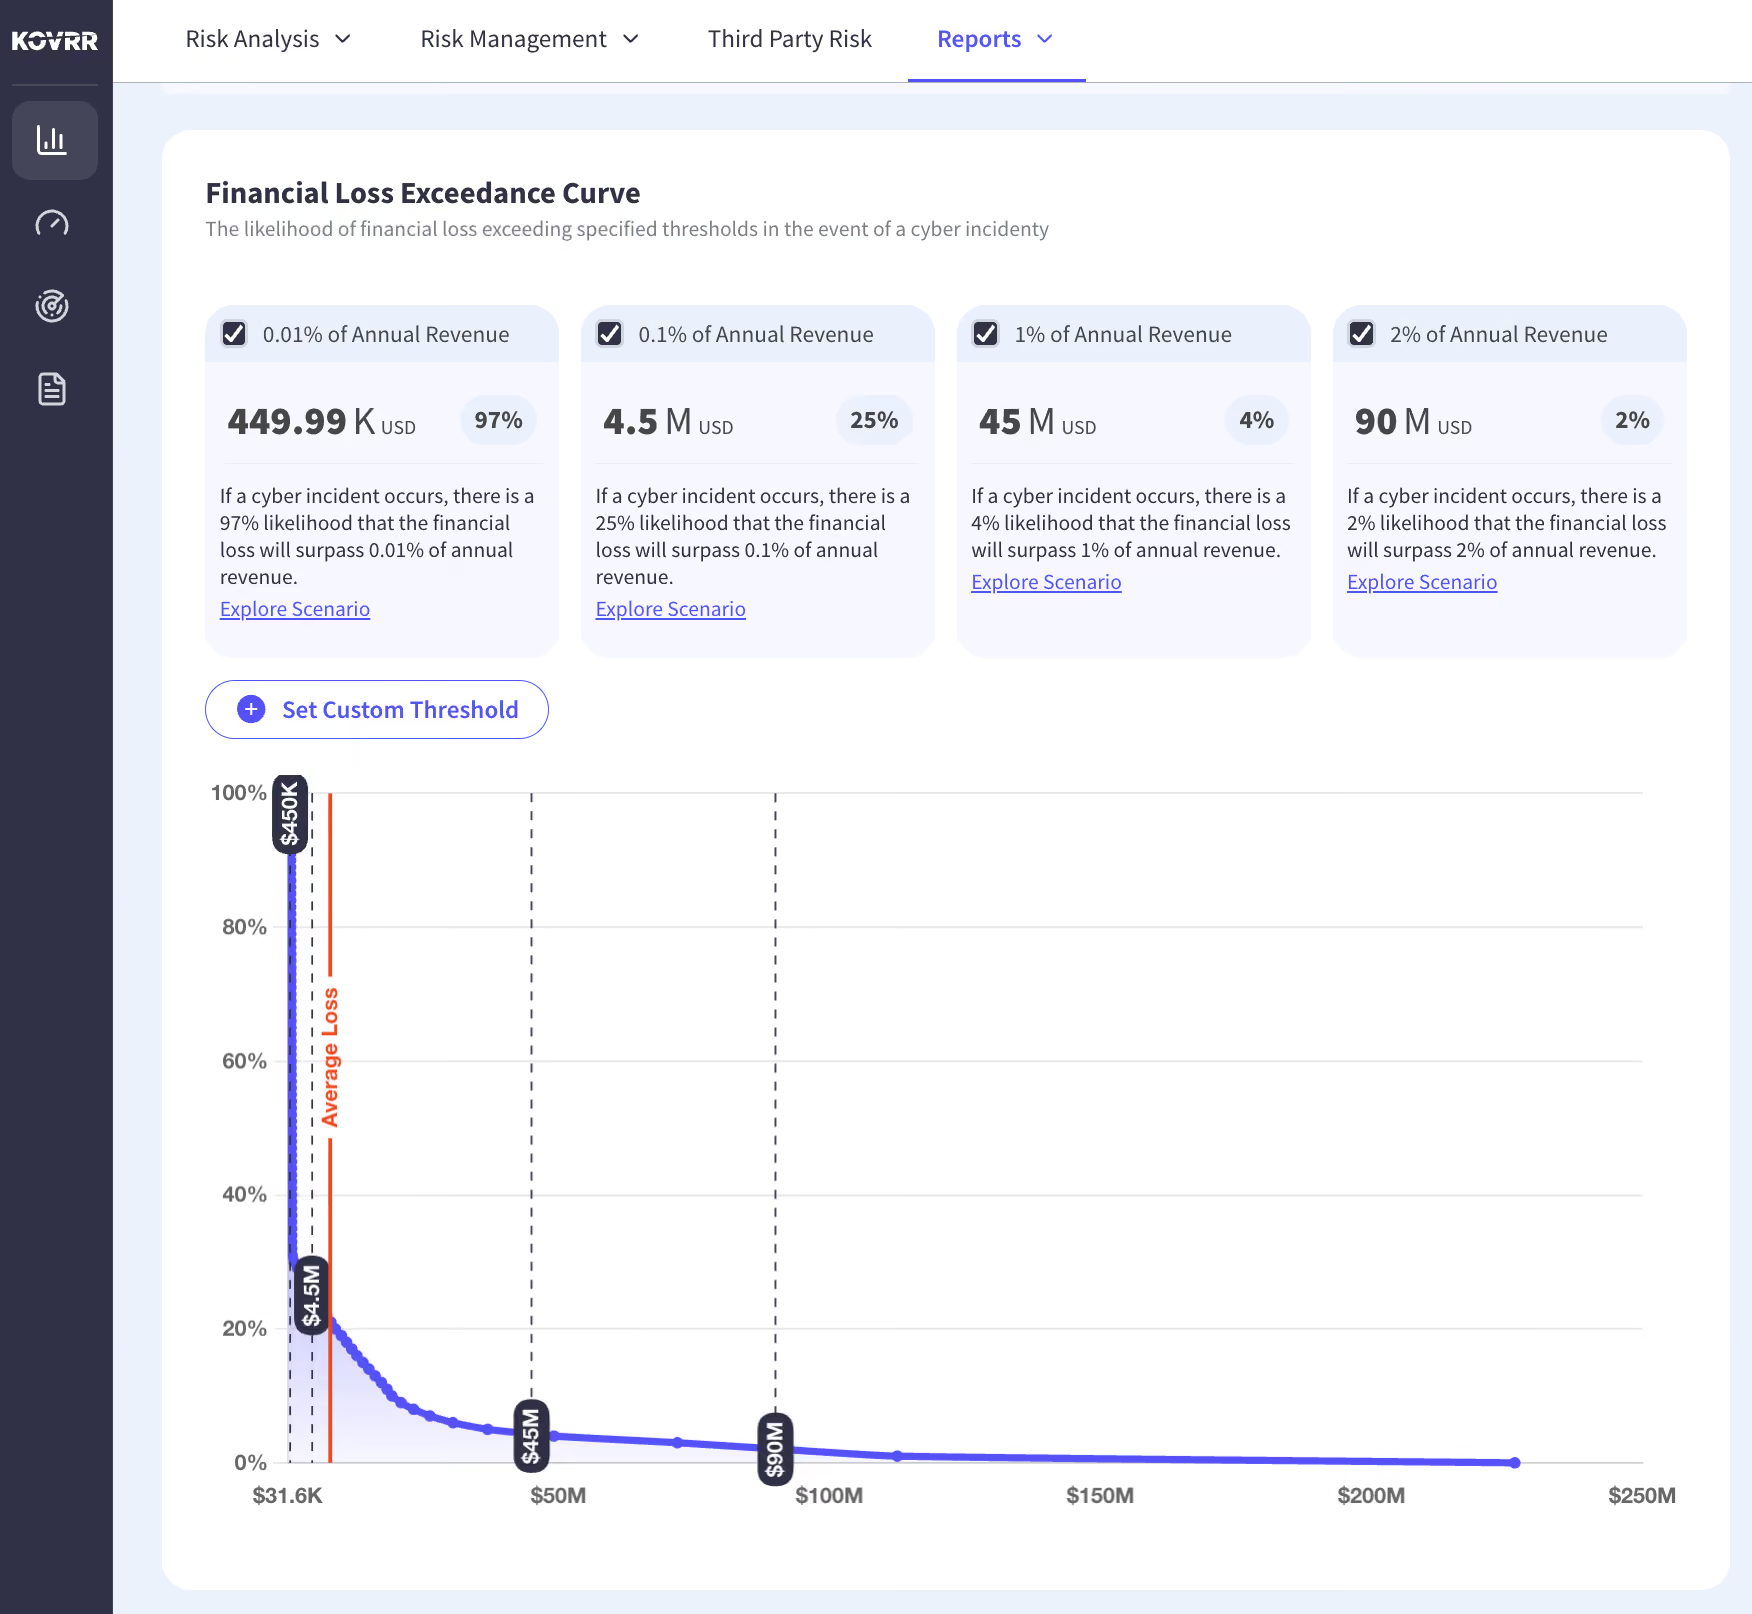
- Loss Exceedance Curves: The Loss Exceedance Curve (LEC) shows the annual probability of exceeding any given loss threshold, exposing the full distribution.
- Distribution reporting: AAL, tail loss, and the full LEC together describe the same underlying distribution, and platforms that report only a single dollar figure are discarding most of the information the model produced.
Why Two Reasonable Models Can Produce Different Numbers
Buyers evaluating CRQ platforms often run the same scenario through multiple vendors and get materially different answers. That is not evidence that one vendor is right and another is wrong. It is evidence that different reasonable modeling choices produce different reasonable outputs, exactly like two weather models producing different forecasts for the same storm.
Different Data Sets and Calibration
One CRQ platform might weight recent breach data more heavily. Another might draw on longer-horizon claims history. One might use industry-specific frequency distributions while another uses cross-industry averages. Each of these choices is defensible, and each will move the number. The buyer's job is to understand which set of assumptions matches the decision they need to make, not to identify a single objectively correct answer that does not exist.
Different Scenario Definitions
Two vendors modeling "ransomware exposure" can be modeling meaningfully different things.
- Does the scenario include supply chain compromise as an entry vector or exclude it?
- Does it treat business interruption as primary loss or secondary loss?
- Does it factor in regulatory penalties, breach notification costs, and reputational damage over what time horizon?
Small differences in scenario definition compound into large differences in output, which is why comparing vendors on scenario framing matters more than comparing them on final numbers.
Why the Answer Is the Decision, Not the Number
The most useful frame for evaluating CRQ output is not "what will happen." It is "what should we do about the forecast." A model that produces defensible outputs, exposes its assumptions, and moves in explainable ways when inputs change is a model buyers can act on.
A model that produces a single confident number without letting anyone examine what went into it is a model to be skeptical of, regardless of how precise the number sounds. Cyber risk modeling delivers value by helping leadership choose the least-worst option and optimize spending against loss potential, which is what the discipline was built for.
What to Look For When Evaluating a CRQ Vendor
Enterprise buyers evaluating CRQ platforms in 2026 face a maturing but still uneven landscape. Two lenses cover the criteria that separate serious platforms from marketing exercises.
Baseline Vendor Evaluation Criteria
- Data provenance: The vendor documents where frequency and severity inputs come from, and the answer references specific claims data, actuarial sources, or incident databases rather than vague "proprietary threat intelligence."
- Documented methodology: The vendor publishes a defensible description of how the model works and how it handles calibration, so buyers can evaluate the approach rather than accept a black-box output.
- Sufficient sample size: The Monte Carlo engine runs enough trials to produce a stable distribution across reruns of the same scenario.
Advanced Differentiators
- Continuous integration with telemetry: The platform ingests data from security tools, cloud environments, identity providers, and third-party sources so the model reflects current control posture rather than an annual snapshot.
- Peer benchmarking built in: Industry-matched exposure comparisons let leadership see how the organization compares to sector peers, not just to itself over time.
- Support for what-if modeling: The platform models the impact of proposed control investments on projected exposure, so buyers can evaluate spending decisions rather than only measure the status quo.
Kovrr's approach is documented in how to choose the right CRQ model and in the ongoing work to standardize the objectivity of control impact forecasts.
Questions to Ask Every CRQ Vendor
Buyers who lead with these questions in a demo separate vendors doing real modeling from those selling a dashboard around a black-box output.
Questions About Methodology
- What data set anchors the frequency inputs?: The answer should reference specific claims data, incident databases, or industry sources, not appeals to "proprietary intelligence."
- How many Monte Carlo trials does each quantification run?: The number should be in the tens of thousands and the vendor should explain why it matters.
- How are severity distributions calibrated?: The vendor should describe how loss magnitude estimates are anchored to observed outcomes rather than analyst opinion.
Questions About Data and Continuity
- How often does the model update?: Continuous integration with security telemetry is the standard to look for, not quarterly manual refresh cycles.
- How is scenario framing standardized across quantifications?: The vendor should be able to describe exactly which losses, entry vectors, and time horizons each scenario covers.
- Can I see the same organization quantified across two vendors?: Willingness to be evaluated against competing platforms on a shared scenario is a meaningful indicator of confidence in the model.
Choosing the “Least-Worst” Option
CRQ accuracy is not about certainty. It is about producing a defensible view of possible outcomes so leadership can make better decisions than they would without a model at all. The models worth trusting are the ones anchored to actuarial-grade data, run enough Monte Carlo trials to produce stable distributions, expose their assumptions rather than hiding them, and update continuously as the threat landscape and control posture change.
Enterprises that evaluate CRQ platforms on these criteria buy tools that hold up under scrutiny from the CFO, the audit committee, and regulators. Enterprises that evaluate on the confidence of a single number get vendor decks that look impressive in a demo and produce numbers no one can defend six months later.
To see how Kovrr's CRQ platform combines actuarial claims data, continuously updated telemetry, and 25,000-trial Monte Carlo simulation into a model built for defensible decision-making, book a demo tuned to your industry and control posture.
CRQ Model Accuracy FAQs
Speak to an ExpertHow accurate are cyber risk quantification models?

What makes one CRQ model more trustworthy than another?
What should I look for when evaluating a CRQ vendor?
Why do different CRQ vendors produce different numbers for the same organization?
How many Monte Carlo trials should a CRQ platform run per quantification?
Is CRQ accurate enough to use for board reporting and SEC disclosure?