
Blog Post
Ranking AI Findings by Risk Reduction Per Dollar
September 16, 2026
A maturity assessment returns forty findings with severity labels attached. Twelve are high, eighteen medium, ten low. They compete for one remediation budget and the labels are the only ordering anyone has.
The standard advice is to group by severity and rank within each tier by cost efficiency, funding the best high-tier items first. The sequence looks disciplined and it keeps the label as a constraint on the ordering, which reintroduces the distortion the efficiency calculation was meant to remove.
What Is a Severity Tier For?
It is a proxy for loss, assigned when loss cannot be estimated. Assigning one is reasonable and it stops being reasonable once the estimate exists.
A label of high means somebody judged the consequence to be large. Where a modeled figure is available, the figure says the same thing with more precision and fewer assumptions, so the label adds nothing. Keeping it as a grouping constraint means a finding with a large loss figure and a modest label cannot be funded ahead of one with a small figure and a large label.
The Wrong Answer Is Specific
A high-rated finding in model governance may be expensive to remediate and remove a modest amount of exposure. A medium-rated finding in vendor oversight may be cheap and remove considerably more. Tier-first ordering funds the first, and the only justification is a label that was standing in for a number now available.
What Does the Ranking Require?
Three things per finding, and where any is missing the ranking cannot be produced with a straight face.
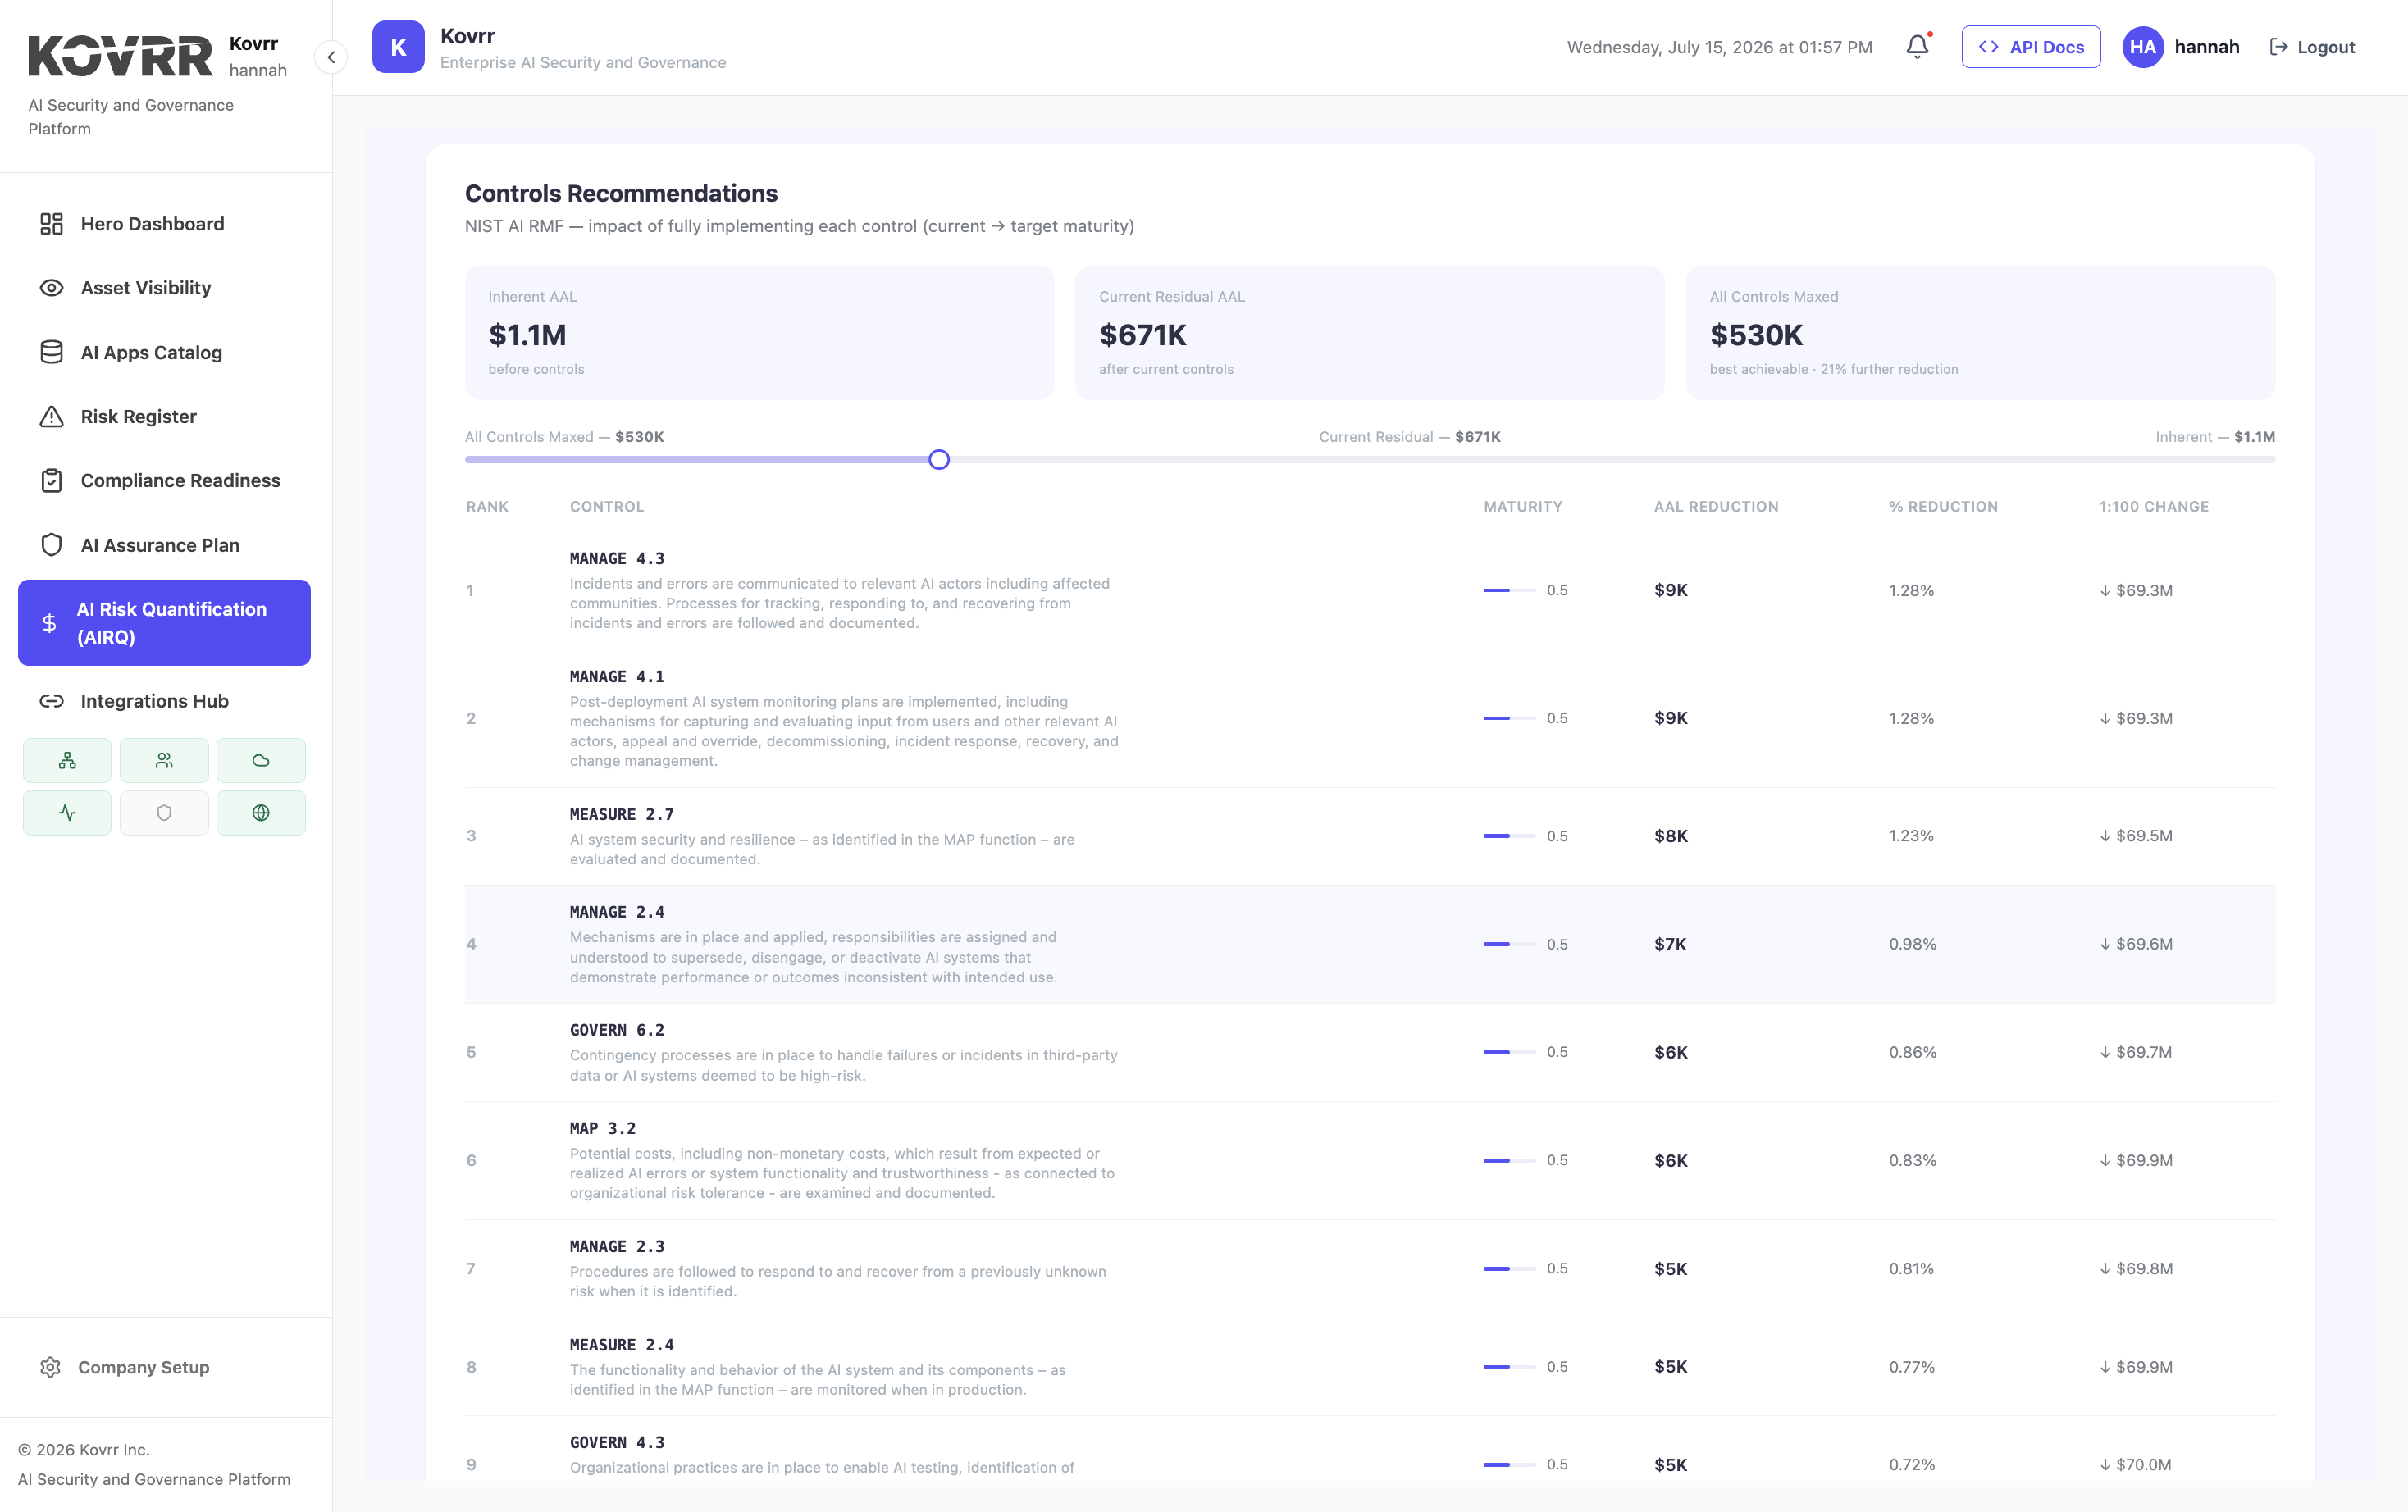
The finding has to map to a scenario, since a control deficiency on its own has no consequence until you say what it exposes. The scenario has to carry a loss figure, which comes from the organization's own asset values rather than from the assessment. The control's contribution to that scenario also has to be estimable, so improving it can be converted into exposure removed.
What If the Chain Breaks?
Say so rather than substituting the label. A finding that cannot be mapped to a scenario, or a scenario nobody has priced, produces no efficiency figure and belongs in a separate list marked as unranked. A ranking with estimated entries silently mixed in is worse than a short ranking with an unranked remainder beside it, and what a modeled figure cannot establish applies to the inputs as much as the output.
What Belongs Outside the Ranking Entirely?
Anything mandatory, which comes out first and gets funded regardless of where efficiency would place it.
A regulatory requirement is not a trade-off. Where an obligation requires a control, its efficiency is irrelevant to whether it happens, so including it in an efficiency ranking either distorts the list or produces a recommendation nobody can act on. Removing mandatory items, funding them, and ranking the discretionary remainder is the sequence that produces a usable list.
Which Items Are Genuinely Mandatory?
Fewer than the register usually implies. A control required by an applicable regulation is mandatory. A control required by a framework the organization chose to align with is a commitment rather than an obligation, and a control somebody described as essential is a judgment. Sorting those three carefully frequently shortens the mandatory list considerably, and which instruments apply is the prior question.
Why Is the Cost Side Harder Than It Looks?
Because remediation cost is not a one-off number, and comparing a capital cost against a recurring one produces a ranking that favors the wrong things.

Four components matter. Engineering effort to implement, which is the figure people usually mean. License or platform cost, which may be annual rather than once. Ongoing operational effort, since a control requiring weekly review costs every week. Opportunity cost completes it, since the team implementing one control is not implementing another.
Which Component Distorts Most?
Ongoing effort, because it is invisible in a project estimate and dominates over a few years. A control costing two weeks to build and four hours a week to operate is more expensive by month six than one costing six weeks and nothing thereafter, and a ranking built on implementation cost alone has them the wrong way round.
What Does the Ranking Change?
The sequence, and the conversation, and the second matters more than people expect.
A heat map invites the question of why something is red, which has no good answer other than a judgment. A ranked list invites the question of why one item sits above another, which is answerable by naming the loss figure, the cost estimate and the assumption behind either. Reframing it converts a disagreement about priorities into a disagreement about an input, which is a considerably more productive argument.
Who Ends Up Disagreeing?
Usually whoever owns the finding that dropped. A control owner whose item moved from second to eleventh will contest the loss figure or the cost estimate, and that contest is the mechanism working rather than a problem. A reviewer able to challenge specifics is what a ranked list makes possible and a matrix does not.
Does the Ranking Hold Over Time?
Less well than a heat map appears to, and the visibility is a feature. Efficiency changes as the estate changes.
A finding's loss reduction depends on the exposure it addresses, and exposure moves when systems are added, asset values change or another control closes part of the same path. A remediation program ranked once and worked through over a year is executing against an ordering that was correct at the start, and re-ranking on material change rather than on schedule keeps it current, which the way an exposure figure moves in steps explains.
What Triggers a Re-Rank?
Completion of anything on the list, since closing one control frequently reduces the value of closing another on the same path. New systems entering scope. Then a change in asset values large enough to move the severity side. None of those is a calendar event.
Does This Work for Findings With No Direct Loss?
Partly, and the honest answer distinguishes two cases that get conflated.
Some findings are enabling rather than protective. An inventory shortfall does not itself cause a loss, and it prevents every later assessment from being complete, so its value is in what it unlocks rather than in what it prevents. Ranking it by exposure removed will place it low, and funding it late means the rest of the ranking was built on incomplete data.
How Should Enabling Findings Be Handled?
Funded ahead of the ranking rather than inside it, on the same basis as mandatory items. A control whose absence degrades the quality of every figure in the list is a precondition for the list rather than an entry in it, and what an inventory can and cannot establish is where that dependency sits.
Which Findings Are Genuinely Enabling?
A short set. Asset inventory completeness, ownership assignment, and whatever produces the telemetry the assessment depends on. Past those, most findings are protective and belong in the ranking, and stretching the enabling category is how a program avoids being ranked at all.
What Can Be Produced This Quarter?
A partial ranking, which is more useful than a complete heat map and achievable without pricing everything.
Take the findings mapped to scenarios that already carry a loss figure, which in most programs is a subset rather than all of them. Rank that subset by exposure removed per unit cost including ongoing effort. Publish it alongside the unranked remainder rather than instead of it. AI risk quantification, or AIRQ, applied to the findings that can carry it produces a defensible ordering for part of the list, and an honest statement about the rest.
Drop the Tier Once You Have the Number
A severity label is a proxy for loss, assigned when loss cannot be estimated, and grouping by it before ranking by efficiency keeps the proxy as a constraint after the estimate exists. Doing so funds expensive high-rated findings ahead of cheap medium-rated ones with more exposure behind them, which is the heat map problem with arithmetic added. Doing it properly requires each finding mapped to a priced scenario with an estimable control contribution, mandatory items removed and funded separately, and a cost figure including ongoing effort rather than implementation alone. Kovrr's AIRQ ranks control improvements by the loss each one removes, which is the ordering the budget conversation needs.
To see AI control findings ranked by the exposure each improvement removes rather than by severity label, book a demo mapped to your own estate.

AI Finding Prioritization FAQs
Speak to an ExpertWhy not group findings by severity tier before ranking them?

What does ranking by loss reduction per dollar require?
What belongs outside the ranking?
Why is remediation cost harder to estimate than it looks?
What else does a ranked list change?
How long does a ranking stay valid?