
Blog Post
Maturity Is a Lagging Indicator. Here's a Leading One.
August 20, 2026
A maturity score answers where a program has been. It reports the state of documented process at the moment somebody assessed it, on a cadence measured in quarters or years, using a scale that describes organization rather than outcome. Every property that makes it useful for planning makes it useless as an early warning.
The interesting question is what a leading indicator would look like instead, and the answer requires separating two problems that get treated as one. A measurement needs the right unit and the right frequency. Most security programs have neither, some have solved one, and a leading indicator requires both at once.
Why Maturity Lags
Two independent reasons, and fixing one leaves the other in place.
It Measures Process, Not Position
Moving a control from managed to optimized describes better organization around that control. Whether the change removed exposure is a separate question, and the two diverge most where the control was already adequate. Program maturity is an input to a risk position rather than a description of one, which is why a program can post improving scores across three years while its exposure moves sideways.
The Cadence Is Too Slow to Signal Anything
An annual assessment produces one data point per year. Two points make a line and three make a trend, so a program on an annual cycle needs three years before it can distinguish improvement from noise, and measurement has to precede prioritization rather than arriving with it. Anything that could be called early warning has to arrive faster than the thing it warns about, and control drift happens in weeks.
The Conventional Split, and Where It Is Wrong
Established practice divides security metrics cleanly. Leading indicators cover process, behavior and hygiene, are treated as key risk indicators, are acknowledged to be harder to instrument, and are aimed at operations teams. Lagging indicators cover incidents, operational failures and impact costs, are treated as key performance indicators, are easier to collect because incidents log themselves, and are aimed at boards.
The taxonomy explains why boards receive lagging metrics. Not because nobody considered the alternative, but because the leading ones cost more to instrument and were designed for a different audience. It also places financial impact firmly in the lagging column, which is where this argument parts company with it.
A cost figure describing an incident that happened is unambiguously lagging. A modeled exposure figure is a different object, since it describes a forward-looking probability distribution rather than a realized loss. What makes it lag is not the unit but the reading frequency, and that distinction is the whole of the argument here.
Unit and Cadence Are Separate Requirements
Programs usually try to fix one and expect the other to follow. Neither substitution works.
Adopting a financial unit without changing cadence produces a better annual number. It becomes comparable against budgets, insurance limits and other business risks, which is a genuine improvement and still a snapshot. Increasing cadence without changing the unit produces frequent maturity scores, which move slowly by construction because process improvement is slow, so the extra measurements mostly repeat each other.
The Combination Produces a Derivative
Measuring the same exposure figure frequently enough gives you its rate of change, and a rate is the first thing in this discussion that qualifies as leading. Direction and slope answer where a program is heading. A level, in any unit, answers where it currently sits. Both matter and only one warns.
What a Leading Indicator Looks Like
The practical form is unglamorous. It is the same measurement, taken on the same methodology, often enough that the difference between consecutive readings means something.
Direction Beats Level for Warning
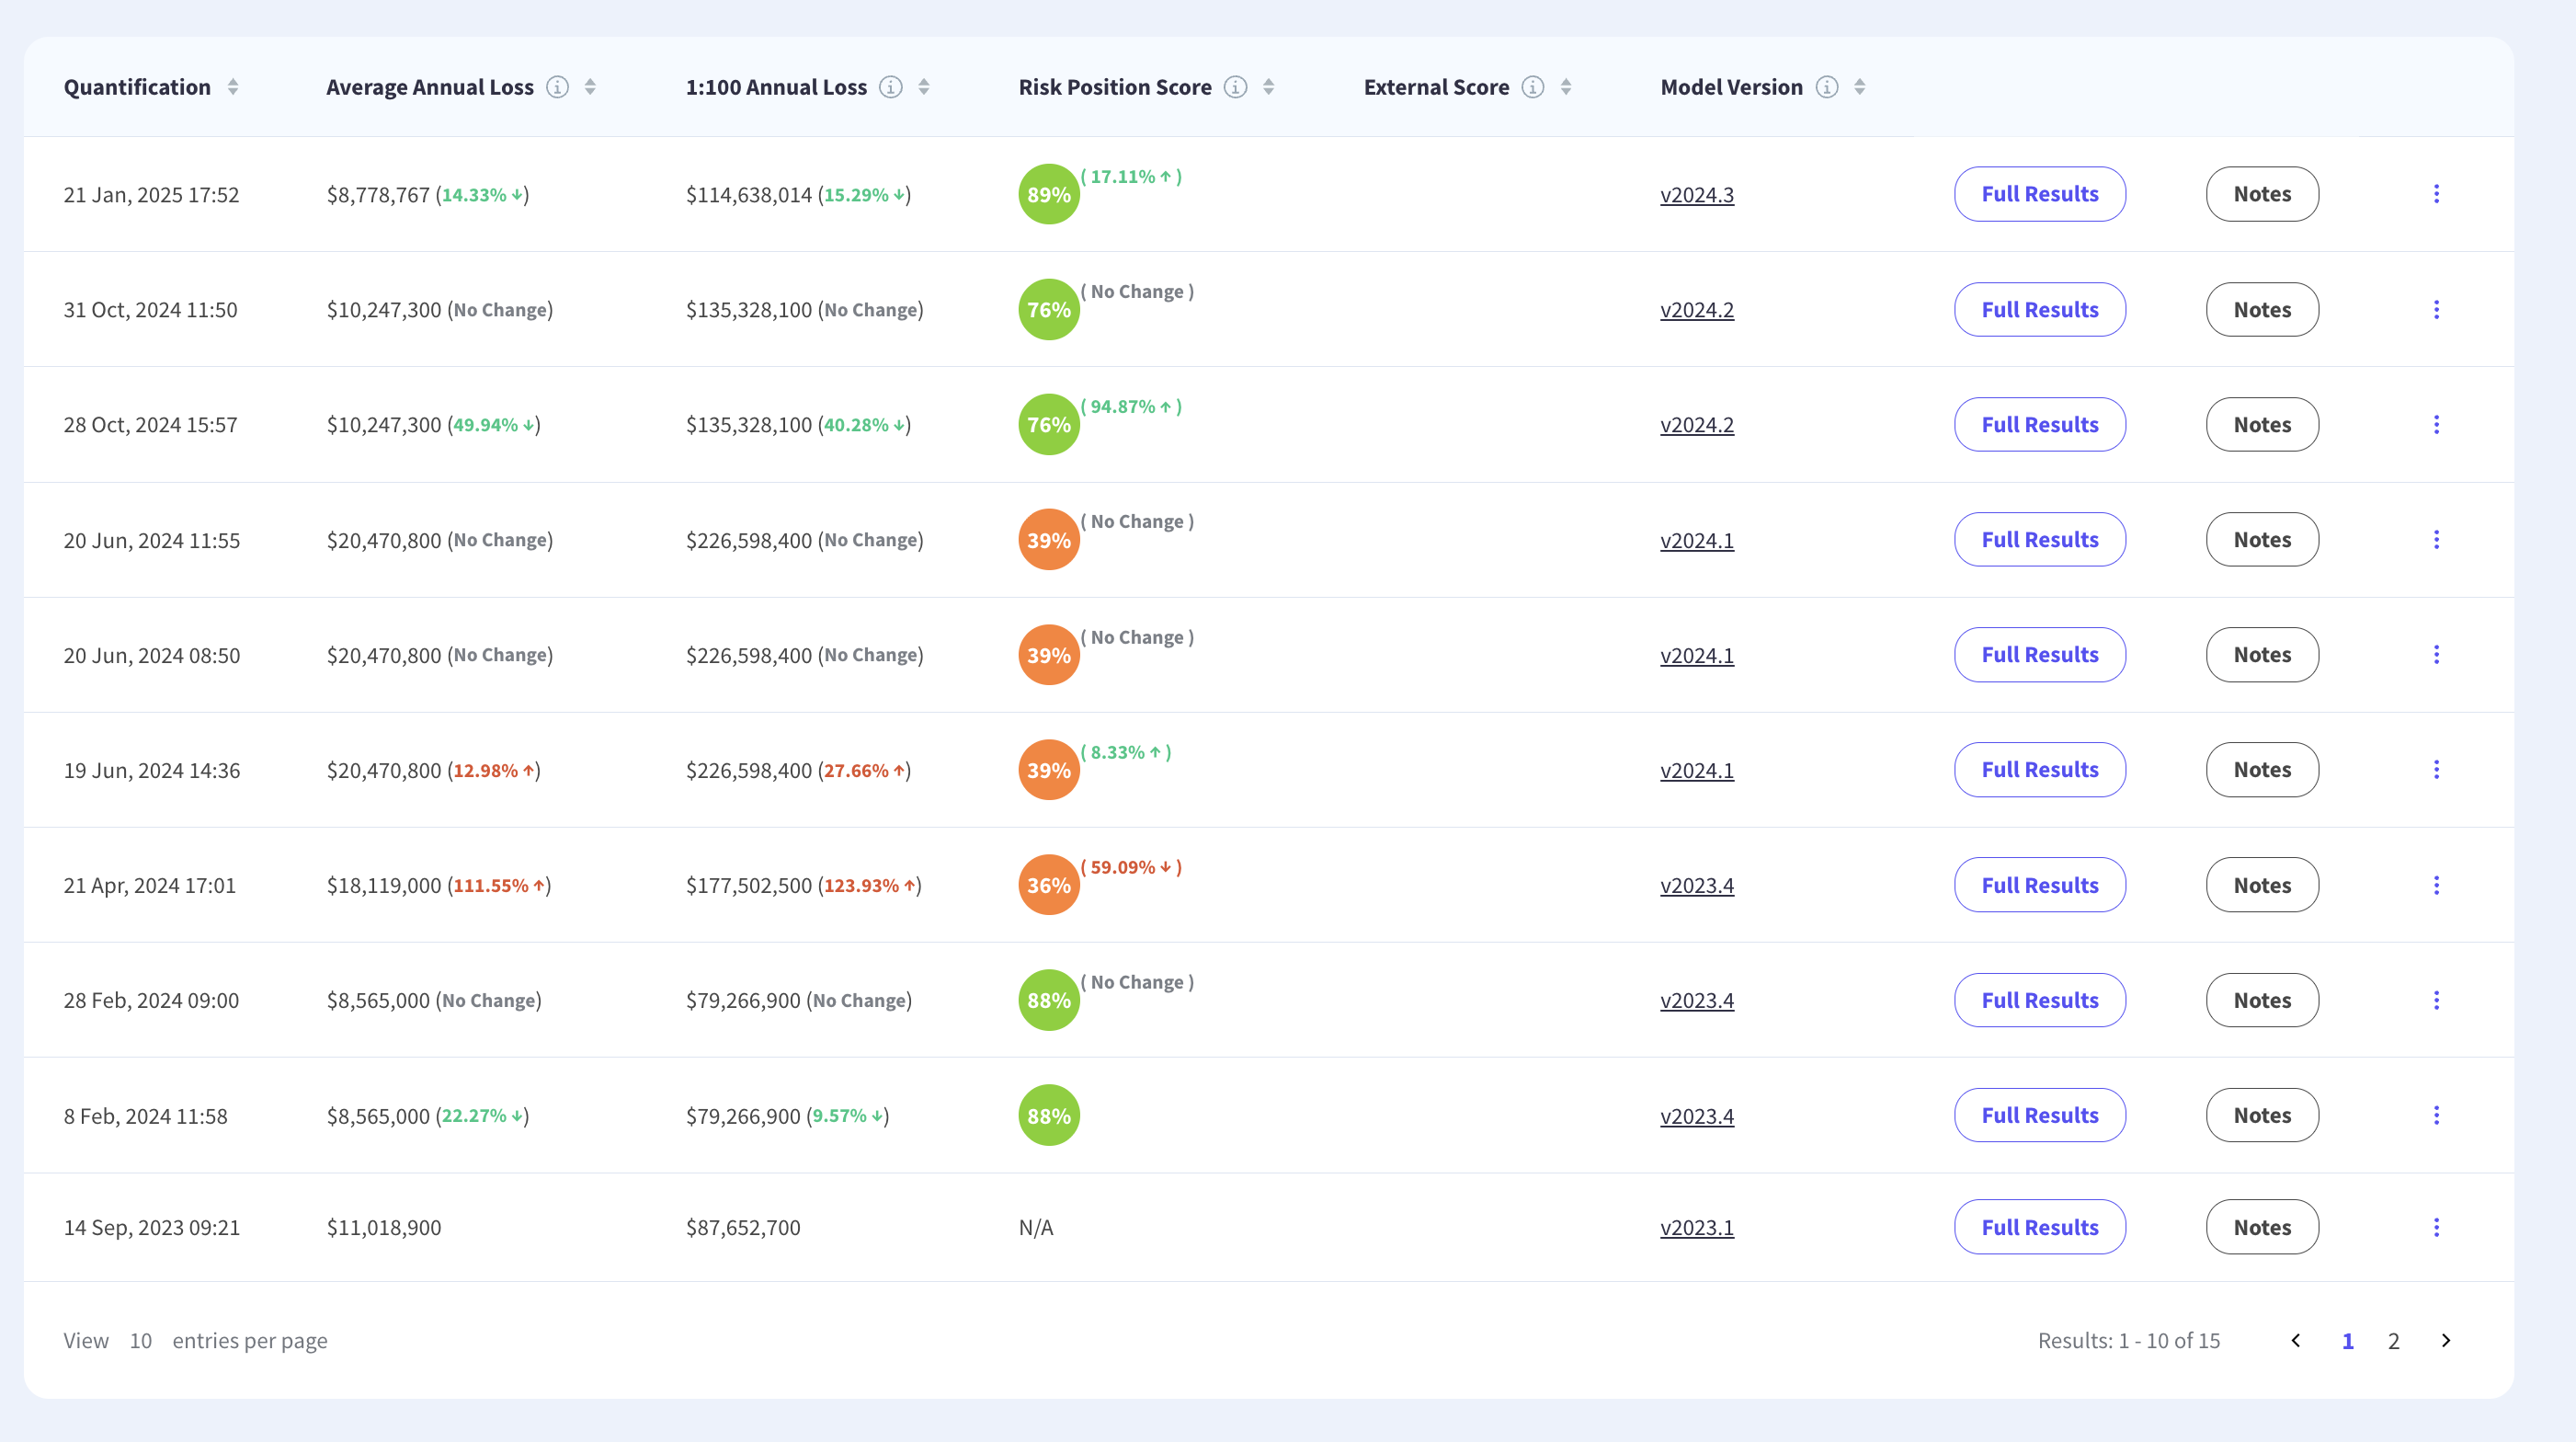
An organization with high exposure trending down is in a better position than one with lower exposure trending up, and a level-only report shows the opposite. Boards asked to interpret a single number reasonably ask whether it is good, which nobody can answer. Shown a slope, they ask what changed, which has an answer. Tracking progress across periods is the reporting form that supports the second conversation.
Methodology Changes Destroy the Signal
A derivative is only interpretable if the measurement stayed constant. Exposure that fell after a model update is not exposure that fell because the environment improved, and one unexplained methodology change makes every subsequent slope suspect. Recording model version beside each reading is what keeps the series usable.
Five Signals Worth Instrumenting
Exposure slope is the headline and it is not the only rate available. Four others move earlier and cost less to collect.
- Misconfiguration Rate at Deployment: The share of newly provisioned assets failing automated policy checks, which no annual test observes.
- Coverage Visibility: The proportion of endpoints, cloud assets and vendors genuinely under a monitored baseline, and how long new ones take to get there.
- Identity Hygiene Drift: Unenforced multi-factor coverage, privileged account creep and policy workarounds, which practitioners treat as reliable risk sensors.
Remediation velocity is the one the field already agrees on, usually expressed as the share of critical findings closed inside the stated service level and described as a core predictor of breach likelihood. Measuring its trend rather than its current value is the addition. Exception net accumulation, meaning exceptions opened minus exceptions closed, completes the set. A program whose remediation is slowing has a problem that will appear in exposure later, which is precisely what makes the velocity leading and the exposure lagging. All four share a property worth noticing, which is that none of them can be produced by a periodic assessment.
Why This Requires Continuous Control Monitoring
Rates need frequent readings and periodic assessment produces infrequent ones, so the measurement model has to change before the metric becomes available. Continuous testing of control state supplies the raw material, since drift, coverage latency and remediation velocity are all properties of a stream.
Continuous Testing Alone Answers a Narrower Question
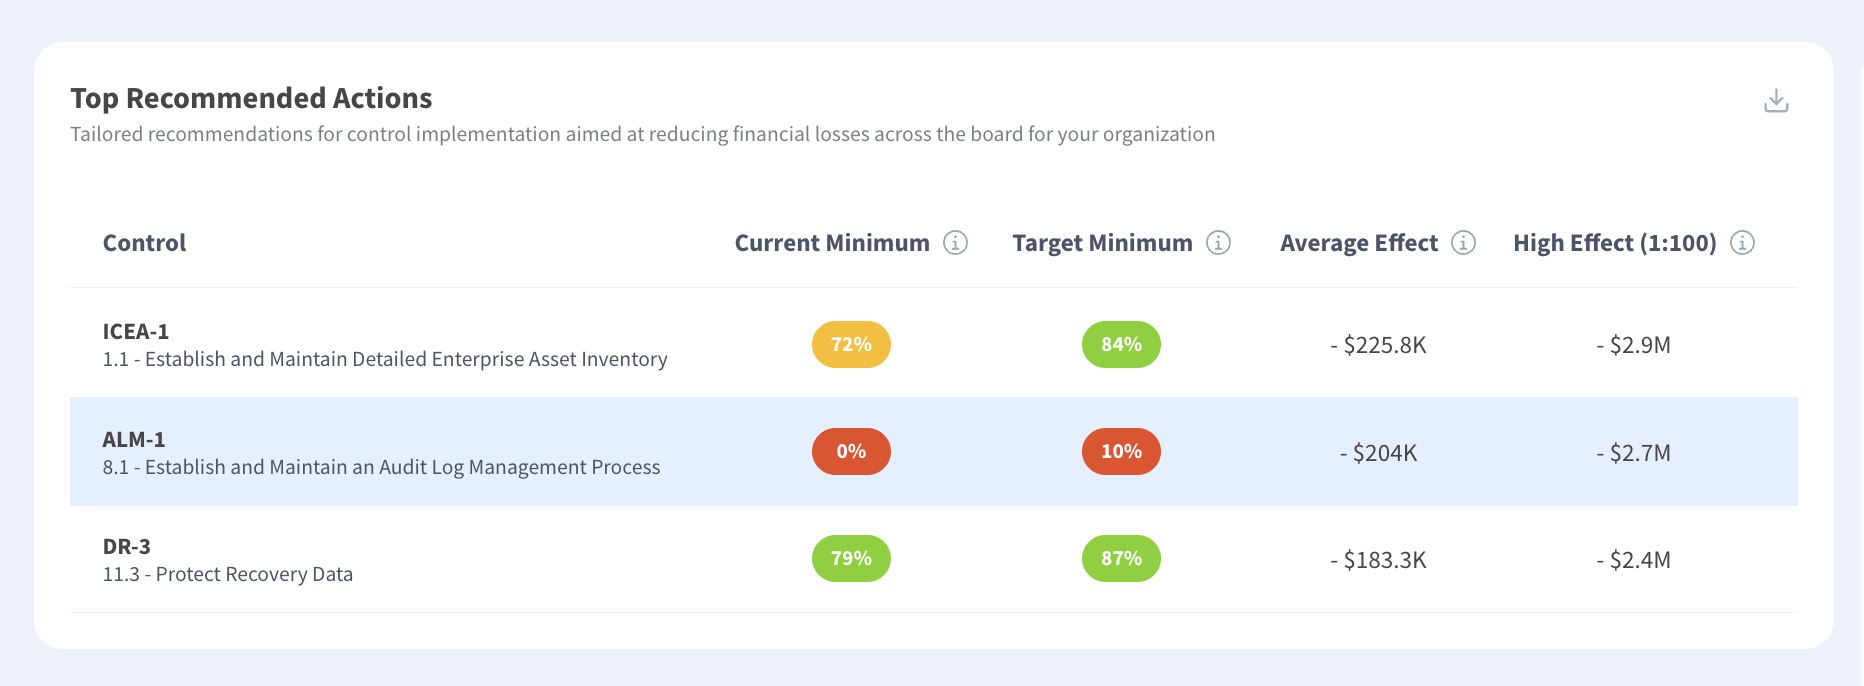
Control monitoring on its own reports that a control stopped operating. It does not report what that costs, so a program with a hundred continuous checks has a hundred binary signals and no way to rank them. Feeding control state into a financial model converts a stream of failures into a moving exposure figure, which is the point at which the two capabilities together produce something neither does alone. Pairing the two exists for that reason rather than as a bundling convenience, since control effectiveness expressed as a percentage is what a model can consume.
Not Every Control Can Be Monitored Continuously
Governance controls resist automation because the evidence is judgment, so a leading-indicator program covers the deterministic portion of the control set and reports the remainder on a periodic basis. Stating which controls sit in which category prevents a coverage figure from being read as describing the whole program, and what annual testing misses sets out where the boundary falls.
Maturity Still Has a Job
Arguing that maturity is lagging is not arguing that it is worthless, and programs that discard it lose three things it does better than anything else.
Maturity models are the right instrument for program design, because they describe what a capable program contains and give a team a target structure. Assessment output also feeds directly into a control assessment, and maturity models are the accepted language for external assurance, since auditors, customers and regulators ask for framework alignment rather than for a derivative. They also support benchmarking against peers in a way a bespoke exposure model cannot, because the scale is shared. Quantified maturity levels keep both readings available rather than choosing between them.
Report Both and Say Which Is Which
The practical arrangement is a maturity position reported annually for structure and assurance, alongside a small set of rates reported monthly or quarterly for direction. Labeling each as lagging or leading in the report itself does more for interpretation than any additional metric, since the common failure is a board reading a slow-moving structural score as though it were an early warning.
Where the Rates Mislead
Two cautions, because rates are as easy to over-read as levels.
A rate computed over too few readings is noise wearing a trend line, and three points is the practical minimum before a slope means anything. A rate can also improve for structural reasons unrelated to the program, since exposure falls when a business unit is divested and control drift falls when deployment slows. Annotating the series with what changed in the environment is what separates a program improving from a business contracting, and turning operational data into risk metrics has to preserve that context to stay interpretable.
Measure the Slope, Report the Level
Maturity lags for two independent reasons, being that it measures process rather than position and arrives too slowly to warn about anything. Fixing the unit produces a better annual snapshot. Fixing the cadence produces repeated structural scores. A leading indicator needs both, which makes it a rate of change in a financial figure rather than a figure at all, and rates require continuous control measurement to exist. Kovrr's continuous control monitoring with quantification produces control state and exposure on the same cadence, so the difference between readings is available rather than annual.
To see control drift, remediation velocity and exposure slope reported on the same cadence for your own environment, book a demo with our cyber risk experts.

Leading Indicator FAQs
Speak to an ExpertWhy is security program maturity a lagging indicator?

Is a quantified exposure figure a leading indicator?
What are practical leading indicators for a security program?
Why does this require continuous control monitoring?
Should organizations abandon maturity models?
How can rate-based indicators mislead?