
Blog Post
How to Transform Cybersecurity Data Into Risk Metrics
August 4, 2026
Enterprise security teams sit on enormous volumes of operational data. Vulnerability scanners produce thousands of findings weekly. Endpoint agents generate millions of events daily. SIEM platforms ingest logs from every system in the environment. Threat intelligence feeds fire off indicators by the hour. All of this data is useful for operational security work. Almost none of it, in raw form, is directly useful for the executive, board, and regulatory conversations that increasingly define modern cyber risk management.
Transforming cybersecurity data into risk metrics is the discipline that bridges the two worlds. It takes raw telemetry from every source the enterprise operates and converts it into the dollar-denominated exposure figures, probability distributions, and trend metrics that leadership uses to make investment, insurance, and disclosure decisions.
This article covers why raw cybersecurity data is not risk data, the four categories of raw inputs every CRQ model needs, the standard formula that converts raw data into risk metrics, how to map common data types to executive-ready outputs, the pipeline architecture that keeps the transformation continuous, and where cyber risk quantification (CRQ) turns raw data into business value at enterprise scale. For the underlying definitional vocabulary, Kovrr's guide to what CRQ is covers the foundation the data-to-metrics pipeline builds on.
Why Raw Cybersecurity Data Is Not Risk Data
Cybersecurity teams generate operational data. Boards, CFOs, cyber insurance underwriters, and regulators consume risk data. The difference is not cosmetic. Raw operational data measures what the security team is doing. Risk data measures what the enterprise is exposed to in terms leadership can act on. Every layer of translation between the two is a layer where value gets lost when it is not built into the platform from the start.
A vulnerability scanner reports 12,000 findings. That number tells the security team about workload. It does not tell the CFO about financial exposure. A SIEM platform shows 4 million events last week. That number tells the SOC about detection volume. It does not tell the board about residual risk.
A control maturity assessment produces a NIST CSF 2.0 average score of 2.85. That number tells the audit committee about program maturity. It does not tell the cyber insurance underwriter about frequency and severity distributions the model needs for pricing. Every one of these operational metrics is legitimate. None of them, standing alone, produces the risk data the enterprise decision-makers actually need.
The Four Categories of Raw Data That Feed CRQ Models
Serious CRQ programs draw on four distinct categories of raw cybersecurity data. Each category answers a different question in the underlying probabilistic model, and all four have to be present for the output to hold up under executive scrutiny.
Categories One and Two: What You Have and What Threatens It
- Asset data: Network topology, data classification, cloud environment inventories, and device populations that define what the enterprise operates.
- Business context data: Revenue dependency, customer trust weighting, and regulatory scope per asset that convert technical inventory into business-value context.
- Threat data: Incident logs, phishing click rates, external threat intelligence feeds, and industry-specific attack pattern data that populate frequency distributions.
Categories Three and Four: What You Are Doing About It
- Vulnerability data: Scan results, patch latency, misconfiguration counts, and exposure surface data that quantify current technical weaknesses.
- Security control data: Endpoint coverage, firewall block rates, MFA enrollment, and training completion rates that measure existing defensive posture.
- Third-party dependency data: Vendor security scores, SBOM-level component data, and supply chain relationship maps that surface externally-driven exposure.
The Standard Formula for Converting Raw Data Into Risk Metrics
Once raw data is categorized, converting it into risk metrics runs through a consistent mathematical process. The core formula is Annualized Loss Expectancy (ALE), which combines the financial impact of a single loss event with the estimated annual frequency of that event occurring.
The Building Blocks
Annualized Loss Expectancy starts from Asset Value, which is the total monetary value of the data, system, or business process at risk. Applying an Exposure Factor produces Single Loss Expectancy, which is the financial impact of a single occurrence of the threat. Estimating the Annualized Rate of Occurrence produces the frequency dimension. Multiplying Single Loss Expectancy by the Annualized Rate of Occurrence produces the Annualized Loss Expectancy figure that becomes the core risk metric leadership sees.
From ALE to Full Loss Distributions
ALE is a point estimate. Modern CRQ programs move past point estimates into full probability distributions through Monte Carlo simulation, which runs thousands of trials against calibrated frequency and severity distributions to produce a complete picture of possible annual losses.
The output includes Average Annual Loss as the expected-value midpoint, tail loss figures at defined confidence intervals, and the Loss Exceedance Curve that shows the full distribution. Programs running fewer than tens of thousands of trials produce outputs that shift between reruns, which is why the update to 25,000 trials per quantification has become the standard reference point for statistical significance.
Why Data Provenance Matters at the Formula Level
Frequency and severity inputs anchored to actuarial-grade claims data produce materially different output than inputs anchored to internal history alone. Cyber incidents are relatively low-frequency events for any single enterprise, so internal data is almost always insufficient to calibrate the model defensibly. The strongest programs draw on insurance industry claims history, multi-source threat intelligence, and continuously updated control posture data to keep the underlying formula operating on real-world calibration rather than analyst estimates.
Mapping Common Raw Data Types to Executive Risk Metrics
Different raw data categories produce different executive risk metrics through the transformation pipeline. Understanding the mapping helps security teams anticipate which operational data will move which strategic conversation.
Vulnerability and Patch Data
- Raw input: Vulnerability scan results, patch latency in hours, CVSS scores per finding.
- Executive metric: Reduction in Average Annual Loss from projected patch remediation, expressed as ROSI when evaluated as an investment.
- Where it lands: Budget justification conversations and quarterly board reporting showing residual exposure movement quarter over quarter.
Threat Intelligence Data
- Raw input: Attack frequency data by industry, threat actor targeting patterns, incident disclosure histories.
- Executive metric: Annualized Rate of Occurrence per threat scenario, feeding both AAL calculations and tail exposure modeling.
- Where it lands: Cyber insurance renewal conversations where underwriters expect defensible frequency inputs anchored to claims-anchored data.
Control Maturity and Effectiveness Data
- Raw input: NIST CSF 2.0 assessment scores, control coverage percentages, MFA enrollment rates.
- Executive metric: Residual risk per scenario after existing controls are factored in, versus inherent risk before controls.
- Where it lands: Enterprise risk register prioritization decisions and executive-facing conversations about where the current program still has unaddressed exposure.
Building the Data Pipeline Architecture
Transforming data into metrics once is an analytical exercise. Doing it continuously as the environment changes is a pipeline architecture problem. Two categories of architecture decisions cover the fundamentals.
Continuous Integration Requirements
- Direct API connections to security tooling: Vulnerability scanners, SIEM platforms, EDR agents, and cloud security posture data ingested continuously rather than through periodic manual exports.
- Real-time control monitoring: Continuous control monitoring that keeps the model current as control implementation and maturity change, without waiting for the next annual assessment.
- Automated data normalization: Consistent handling of vulnerability severity scores, incident classifications, and control coverage metrics across every data source the pipeline touches.
Governance and Guardrail Requirements
- Defined risk appetite thresholds: Explicit dollar amounts the enterprise is willing to accept as residual exposure per category, so pipeline outputs translate directly into approve-or-escalate decisions.
- Normalized output scales for non-technical audiences: Calculated risk scores mapped to consistent enterprise-wide scales alongside the raw dollar figures, so board-facing summaries and technical drill-downs draw from the same underlying data.
- Documented pipeline provenance: Every risk metric traceable back to the specific raw data inputs, calibration decisions, and modeling assumptions that produced it, so auditors and regulators can reconstruct the transformation on demand.
Where CRQ Turns Data Pipelines Into Continuous Business Value
Cyber risk quantification is the analytical engine that makes the data-to-metrics pipeline defensible at enterprise scale. Without CRQ, the transformation runs on estimates that reasonable people can dispute. With CRQ, the transformation runs on probability distributions calibrated against actuarial-grade data that hold up under executive scrutiny.
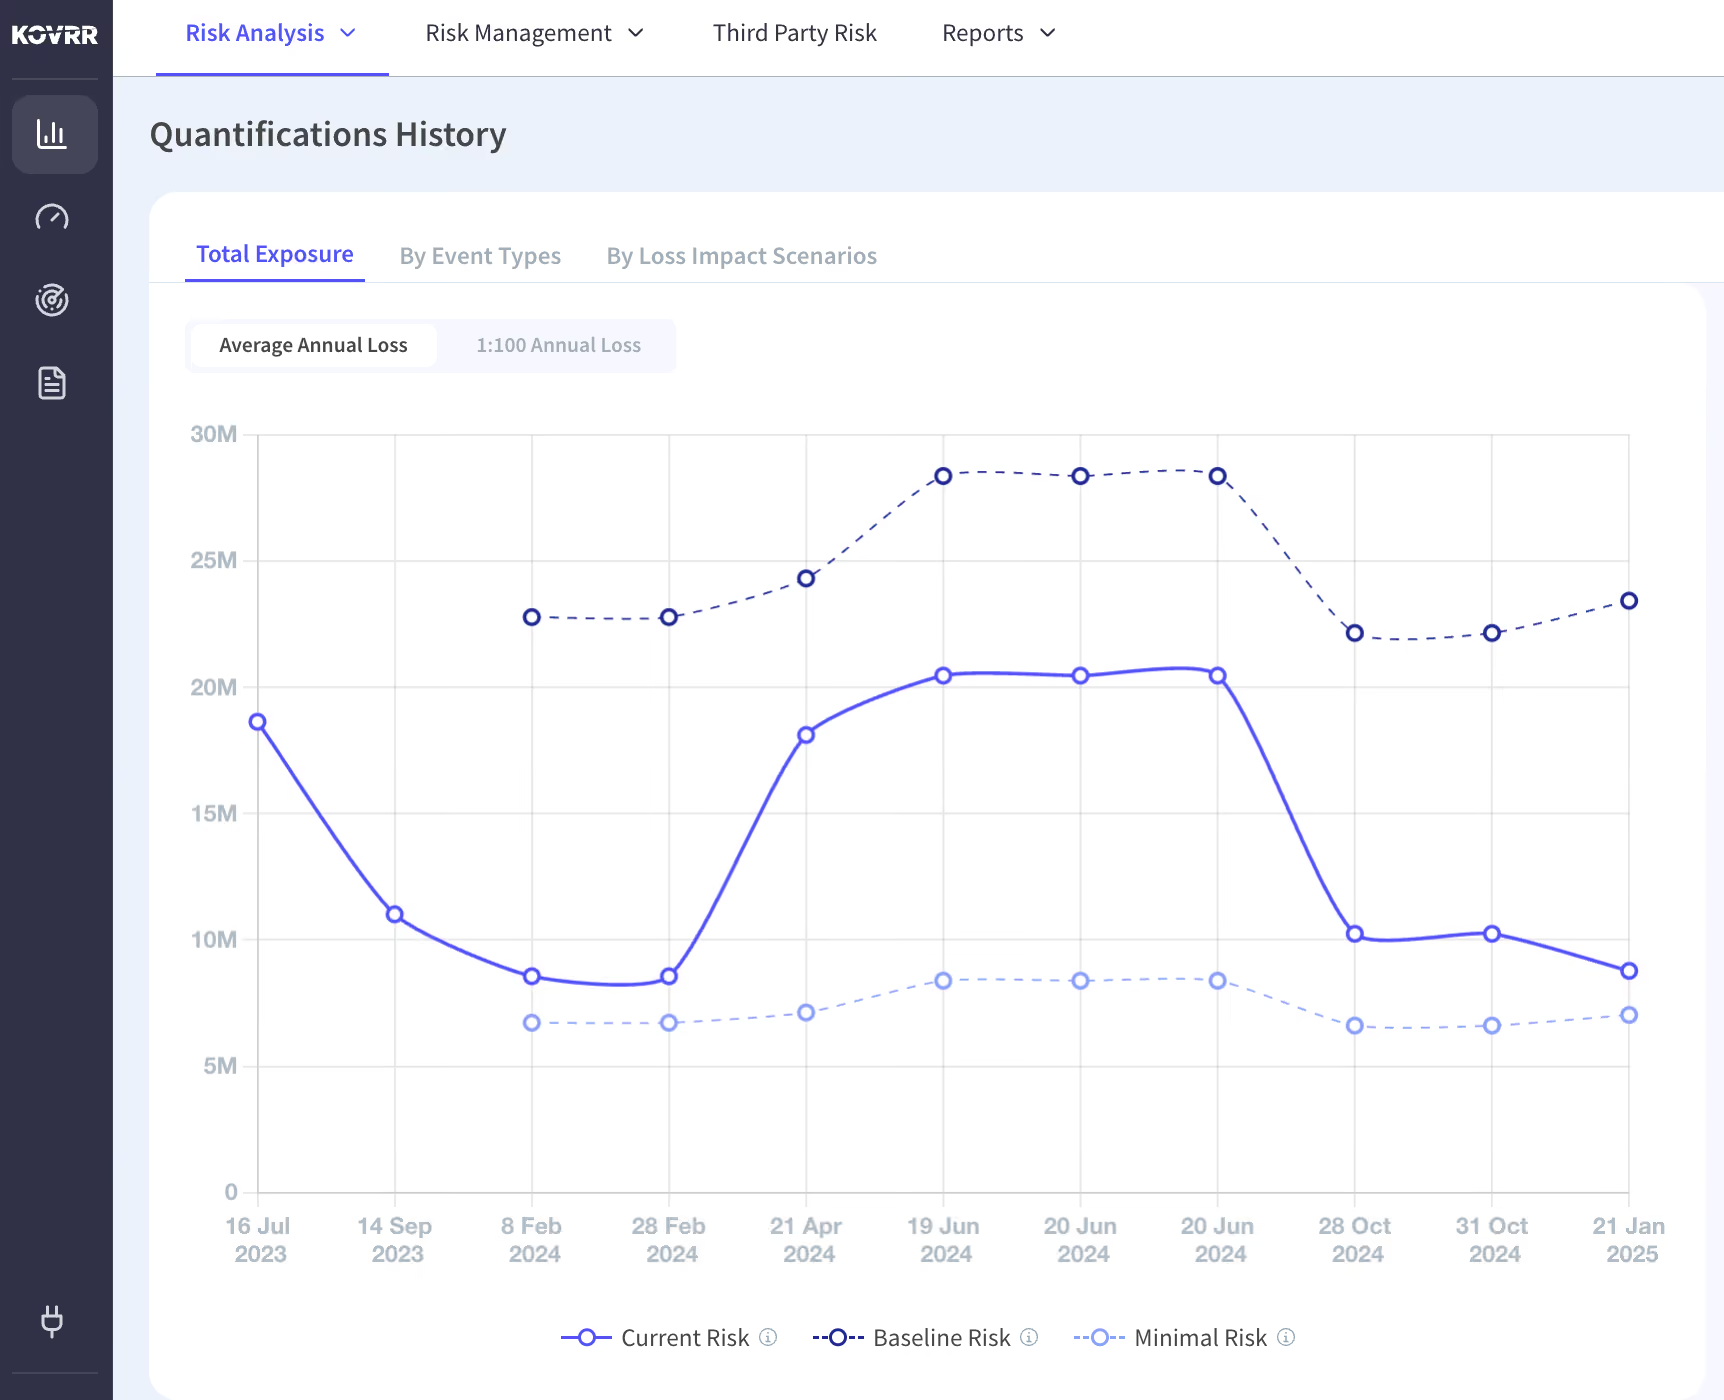
Kovrr's cyber risk quantification platform ingests raw data continuously across all four categories the model needs. Asset inventory with business criticality weighting. Threat intelligence anchored to insurance industry claims data. Vulnerability data from existing scanning infrastructure through direct API integrations. Control maturity data from NIST CSF 2.0 assessments and continuous control monitoring feeds.
The output is a continuously updated set of executive-ready risk metrics rather than a periodic report. Every material change in the underlying data flows through the pipeline into refreshed Average Annual Loss figures, updated tail exposure, and current-state risk register entries that leadership can act on the same week the environment moves.
Making the Data-to-Metrics Pipeline Continuous
Transforming cybersecurity data into risk metrics is not a periodic analytical exercise. It is an operating discipline that runs continuously in the platform layer, updates as the underlying environment changes, and produces the executive-ready outputs every strategic cyber conversation depends on. Programs that build the four-category data model, run it through a rigorous transformation formula anchored to actuarial-grade calibration, and deliver the results through a continuous pipeline architecture produce the strategic leverage the discipline was built for.
Programs that treat data-to-metrics as an annual reporting event produce compliance artifacts and little else. The organizations moving fastest on this in 2026 are the ones combining continuous CRQ, modern cyber risk modeling, and integrated pipeline architectures into an operating discipline the board can trust across cycles.
To see how Kovrr's platform turns raw cybersecurity data from your existing tooling into continuously updated executive risk metrics, book a demo tuned to your industry and control posture.
Transform Cyber Data FAQs
Speak to an ExpertHow can I transform cybersecurity data into risk metrics?

What are the four categories of raw cybersecurity data every CRQ program needs?
What is the difference between operational security metrics and executive risk metrics?
Why is data provenance important for CRQ risk metrics?
How does continuous control monitoring feed the CRQ pipeline?
How often should the data-to-metrics pipeline refresh?