
Blog Post
When Two Cyber Risk Models Disagree on the Same Company
October 4, 2026
Two quantification exercises run on the same company return different figures, and the usual response is to ask which one is right, which is the wrong question and produces an argument nobody wins.
Both may be defensible. The difference traces to specific assumptions, and working backward to find which ones is a procedure rather than a debate, with the cheapest checks first because they explain the most.
Are They Answering the Same Question?
The first check, and it resolves a large share of cases at no cost.
One exercise may be scoped to the enterprise and the other to a single database holding regulated records. One may cover a year and the other a single event. A tenfold difference is available from scope alone, and where the scopes differ the two figures are not in disagreement, they are answers to two questions.
Which Makes It a Category Error Rather Than a Dispute
Most apparent model disagreements resolve here or at the next step, and both checks require reading a definition rather than examining a method. Doing them before convening anybody saves the meeting.
Are They Reporting the Same Statistic?
The second free check, and the one most often skipped.

An average annual figure and a one-in-hundred figure come from the same distribution and should differ by an order of magnitude. Comparing one against the other and concluding the models disagree mistakes two points on a curve for two curves.
Which Statistic Should the Comparison Use?
Whichever the decision rests on, and the same one from both. A capital or limit decision reads the tail, a budgeting decision reads the average, and reading a distribution at more than one point is what makes both available from one model rather than requiring two.
Where Does the Comparison Start?
At frequency, because it is a single number in each model and it isolates one side of the calculation.
Expected events per year, for the same scenario and scope. Where those differ, the divergence is on the likelihood side and the diagnostic question is what each model used as its source. One may rest on internal incident history and the other on industry-wide observation, which produce different answers for the same organization and both are legitimate.
Which Source Should Win?
Neither automatically. Internal history is specific and thin, industry observation is broad and generic, and an organization with few incidents has almost no signal in the first, which working without an incident history addresses directly.
What Is the Largest Single Divergence?
Whether secondary losses are included at all, because the omission is binary and its effect is large.
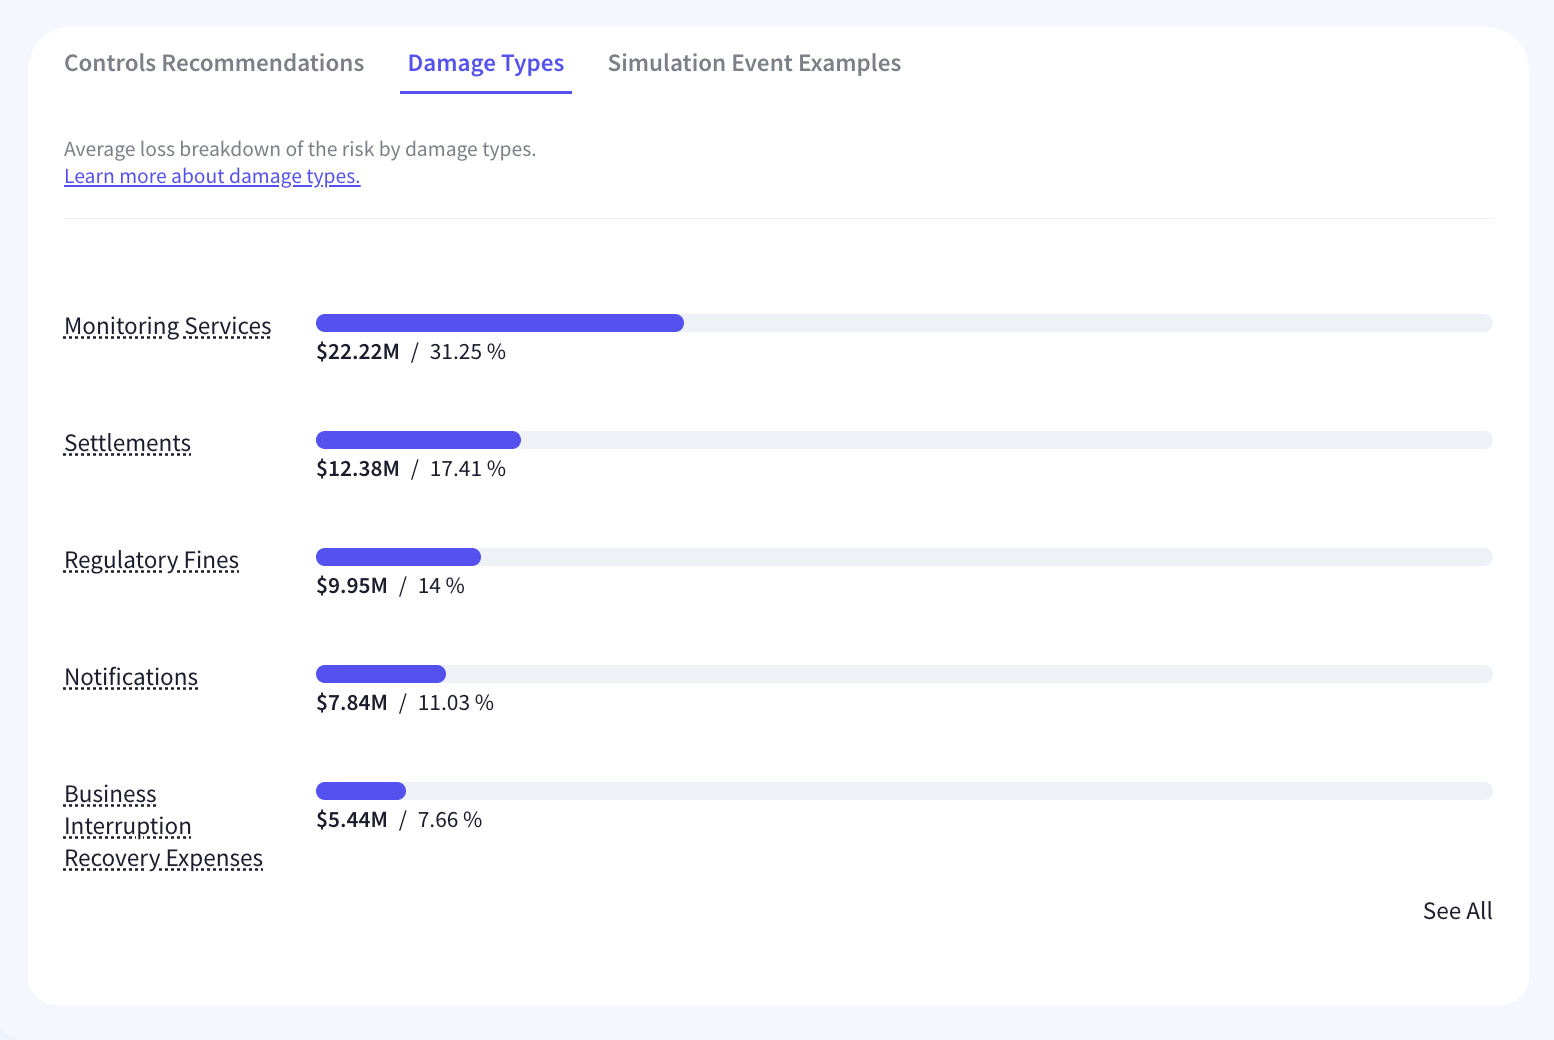
Primary losses cover response, forensics and legal fees. Secondary losses cover regulatory penalties, litigation and long-term commercial damage. A model that omits the second produces a systematically lower figure, and the difference is easy to detect because a category is either present or absent.
Which Is Also the Easiest to Resolve
Adding a missing category is arithmetic rather than a methodological argument. Once both models cover the same damage types the remaining difference is smaller and the discussion moves to something substantive.
How Is Control Effectiveness Treated?
Binary in one model and graduated in the other, frequently, and this one is closer to an error than a choice.
A binary treatment records a control as deployed and treats the risk as removed. A graduated treatment assigns partial effectiveness, accounting for misconfiguration, coverage limits and human error. The first produces a lower residual figure and the difference is not a matter of opinion, since no control operates at full effectiveness across an entire estate.
What Should Be Asked About It?
What effectiveness percentage each control was assigned and on what evidence. A model with no answer has used a default, and stating what a control removes is the standard that answer should meet.
What Should the Reconciliation Produce?
A decomposition rather than a winner, which is what converts the exercise from an argument into an accounting.
The useful output is a statement that of a fourfold difference, most is scope, some is the omission of secondary losses, and the remainder is frequency source. Each component is then either accepted as a legitimate difference in question or resolved as an input disagreement.
Which Differences Are Legitimate?
Scope and statistic differences are legitimate where both were intended. Frequency source and distribution shape are judgments that can be defended either way. Omitting a damage category is a choice with a consequence. Treating controls as binary is generally wrong, and auditing a model somebody else built works through the same list from one side rather than two.
Who Should Run the Reconciliation?
Neither model's owner, because each has a position to defend before the exercise starts.
A reconciliation run by one side becomes a defense of that side's figure, and the decomposition stops at the point where the other model looks wrong. Run by somebody with no figure to protect, the exercise reaches the components that are genuinely arguable rather than stopping at the first one that settles it favorably.
What Does That Person Need?
Access to the inputs rather than the outputs, meaning scope definitions, frequency assumptions, damage categories and control effectiveness values from both. A reconciliation conducted on reports rather than inputs can only compare totals, which is the comparison that produced the disagreement.
What If Only One Model Is Documented?
Then the exercise becomes an examination of the documented one, and the undocumented figure cannot participate. Saying so plainly is more useful than treating an unexplained number as a competing view, and what a modeled figure cannot establish applies with more force to one nobody can inspect.
What Should Be Established?
Three things, in order, and the first two take minutes.
The scope and time basis of each figure, since a mismatch there means there is nothing to reconcile. Which statistic each number represents, for the same reason. Then the expected events per year and the median loss per event from each model, because those two numbers isolate the likelihood and severity sides separately. Cyber risk quantification that exposes the whole curve rather than a single figure is what allows the comparison to be made at the same point in both models.
Decompose, Do Not Adjudicate
Two defensible exercises on the same company return different figures, and asking which is right produces an argument rather than an answer. The first two checks are free, since a scope mismatch or a different reported statistic means the figures are answers to different questions rather than disagreements, and most apparent disputes resolve there. After those, comparing expected events per year isolates the likelihood side and median loss per event isolates severity. The largest single divergence is usually whether secondary losses are included at all, because the omission is binary and easy to detect. Binary control treatment is the one difference closer to an error than a judgment. The output should also be a decomposition attributing the difference to named components. Kovrr's cyber risk quantification exposes the whole curve so the comparison happens at the same point.
To see exposure reported as a full distribution rather than a single figure, book a demo with our risk experts.

Model Divergence FAQs
Speak to an ExpertWhy do two cyber risk models give different numbers for the same company?

What should you check first when two risk models disagree?
How do you reconcile two cyber risk model outputs?
Does omitting secondary losses change a cyber risk figure?
Should control effectiveness be treated as binary or graduated?
What should a model reconciliation produce?