Blog Post
Cybersecurity Budget Planning for 2027
October 16, 2026
A budget presented as a total invites one question with two answers, approve or reduce. A budget presented as a ranked list invites a different question, which is where to draw the line, and that is a decision a board can make rather than a negotiation it can only win or lose.
The ranking comes from one calculation per candidate control. Expected loss before, minus expected loss after, divided by cost. Order the list by that ratio and the budget builds itself, including the part that says stop.
What Does the Ratio Tell You?
Where the spending should end, which is the half of the method most budget guidance leaves out.
Above One
A control removing more expected loss than it costs returns value in the terms the organization already uses for every other investment. Items here are fundable on their own arithmetic rather than on an argument about threat levels.
Below One
A control costing more than the loss it removes destroys value. Funding it anyway may still be correct where a regulation compels it or a contract requires it, and the reason then has to be named as compliance rather than presented as risk reduction.
Why the Ceiling Matters
A method producing a stopping point is more credible than one producing only a request. A security function that says this is where further spending stops paying is believed on the items below that line, and building the case on return rather than fear depends on being willing to make that statement.
What Does a Board Ask at Sign-Off?
Three questions, and a total answers none of them.
What Happens if We Fund Nothing
The do-nothing position, expressed as exposure under the current posture rather than as a warning. Boards ask it to establish the baseline every other figure is measured against, and a proposal arriving without it has no reference point.
What Does the Last Dollar Buy
The marginal question, and the one a total obscures completely. A ranked list answers it by construction, since the last funded item is the marginal item and its ratio is the answer.
What Would You Cut
Asked to test whether the list was ordered deliberately. A security leader who can name the first item to go and state what it costs in exposure has demonstrably ranked the list, and one who cannot has presented a wish rather than a plan.
Which Controls Reduce Frequency and Which Reduce Magnitude?
Both appear in expected loss and they fail differently, so the distinction belongs in the presentation even though the arithmetic absorbs it.
Frequency Controls
Measures reducing how often an event occurs, covering access restriction, patching cadence and phishing resistance. They lower the number of draws and leave the severity of any event that still happens unchanged.
Magnitude Controls
Measures reducing what an event costs once it starts, covering segmentation, backup recovery speed and incident response readiness. Boards ask about these directly when they ask whether a spend cuts recovery time rather than only improving prevention.
Why the Split Should Be Visible
A portfolio weighted entirely toward frequency leaves the tail untouched, and the tail is what a capital decision rests on. Showing the ranked list grouped by which term each control moves surfaces that imbalance before somebody else finds it.
What Is the Sequence Against a Fiscal Calendar?
Six steps, working backwards from the sign-off date, where the first has a dependency the others do not.
- Establish the baseline: Current exposure modeled before any control is evaluated, since everything else is measured against it.
- Enumerate candidates: Every proposed control with a verified cost attached, including license, implementation and the people to run it.
- Model each reduction: Expected loss after the control is in place, assessed individually rather than as a bundle.
The Remaining Three
Rank by ratio and locate where it crosses one. Draft the ask as tiers rather than a figure. Then pre-brief whoever will be asked to approve it, since a finance leader meeting the method for the first time in the room will spend the meeting on the method rather than on the decision.
The Dependency Worth Knowing
Nothing after the first step works without the first step. An organization with no current exposure figure in September cannot produce a ranked list by November, which makes baselining the task to start before budget season rather than during it.
How Do You Show What Last Year Delivered?
With the same unit at two points in time, which is harder than it sounds and decides whether next year's ask is believed.
What the Comparison Needs
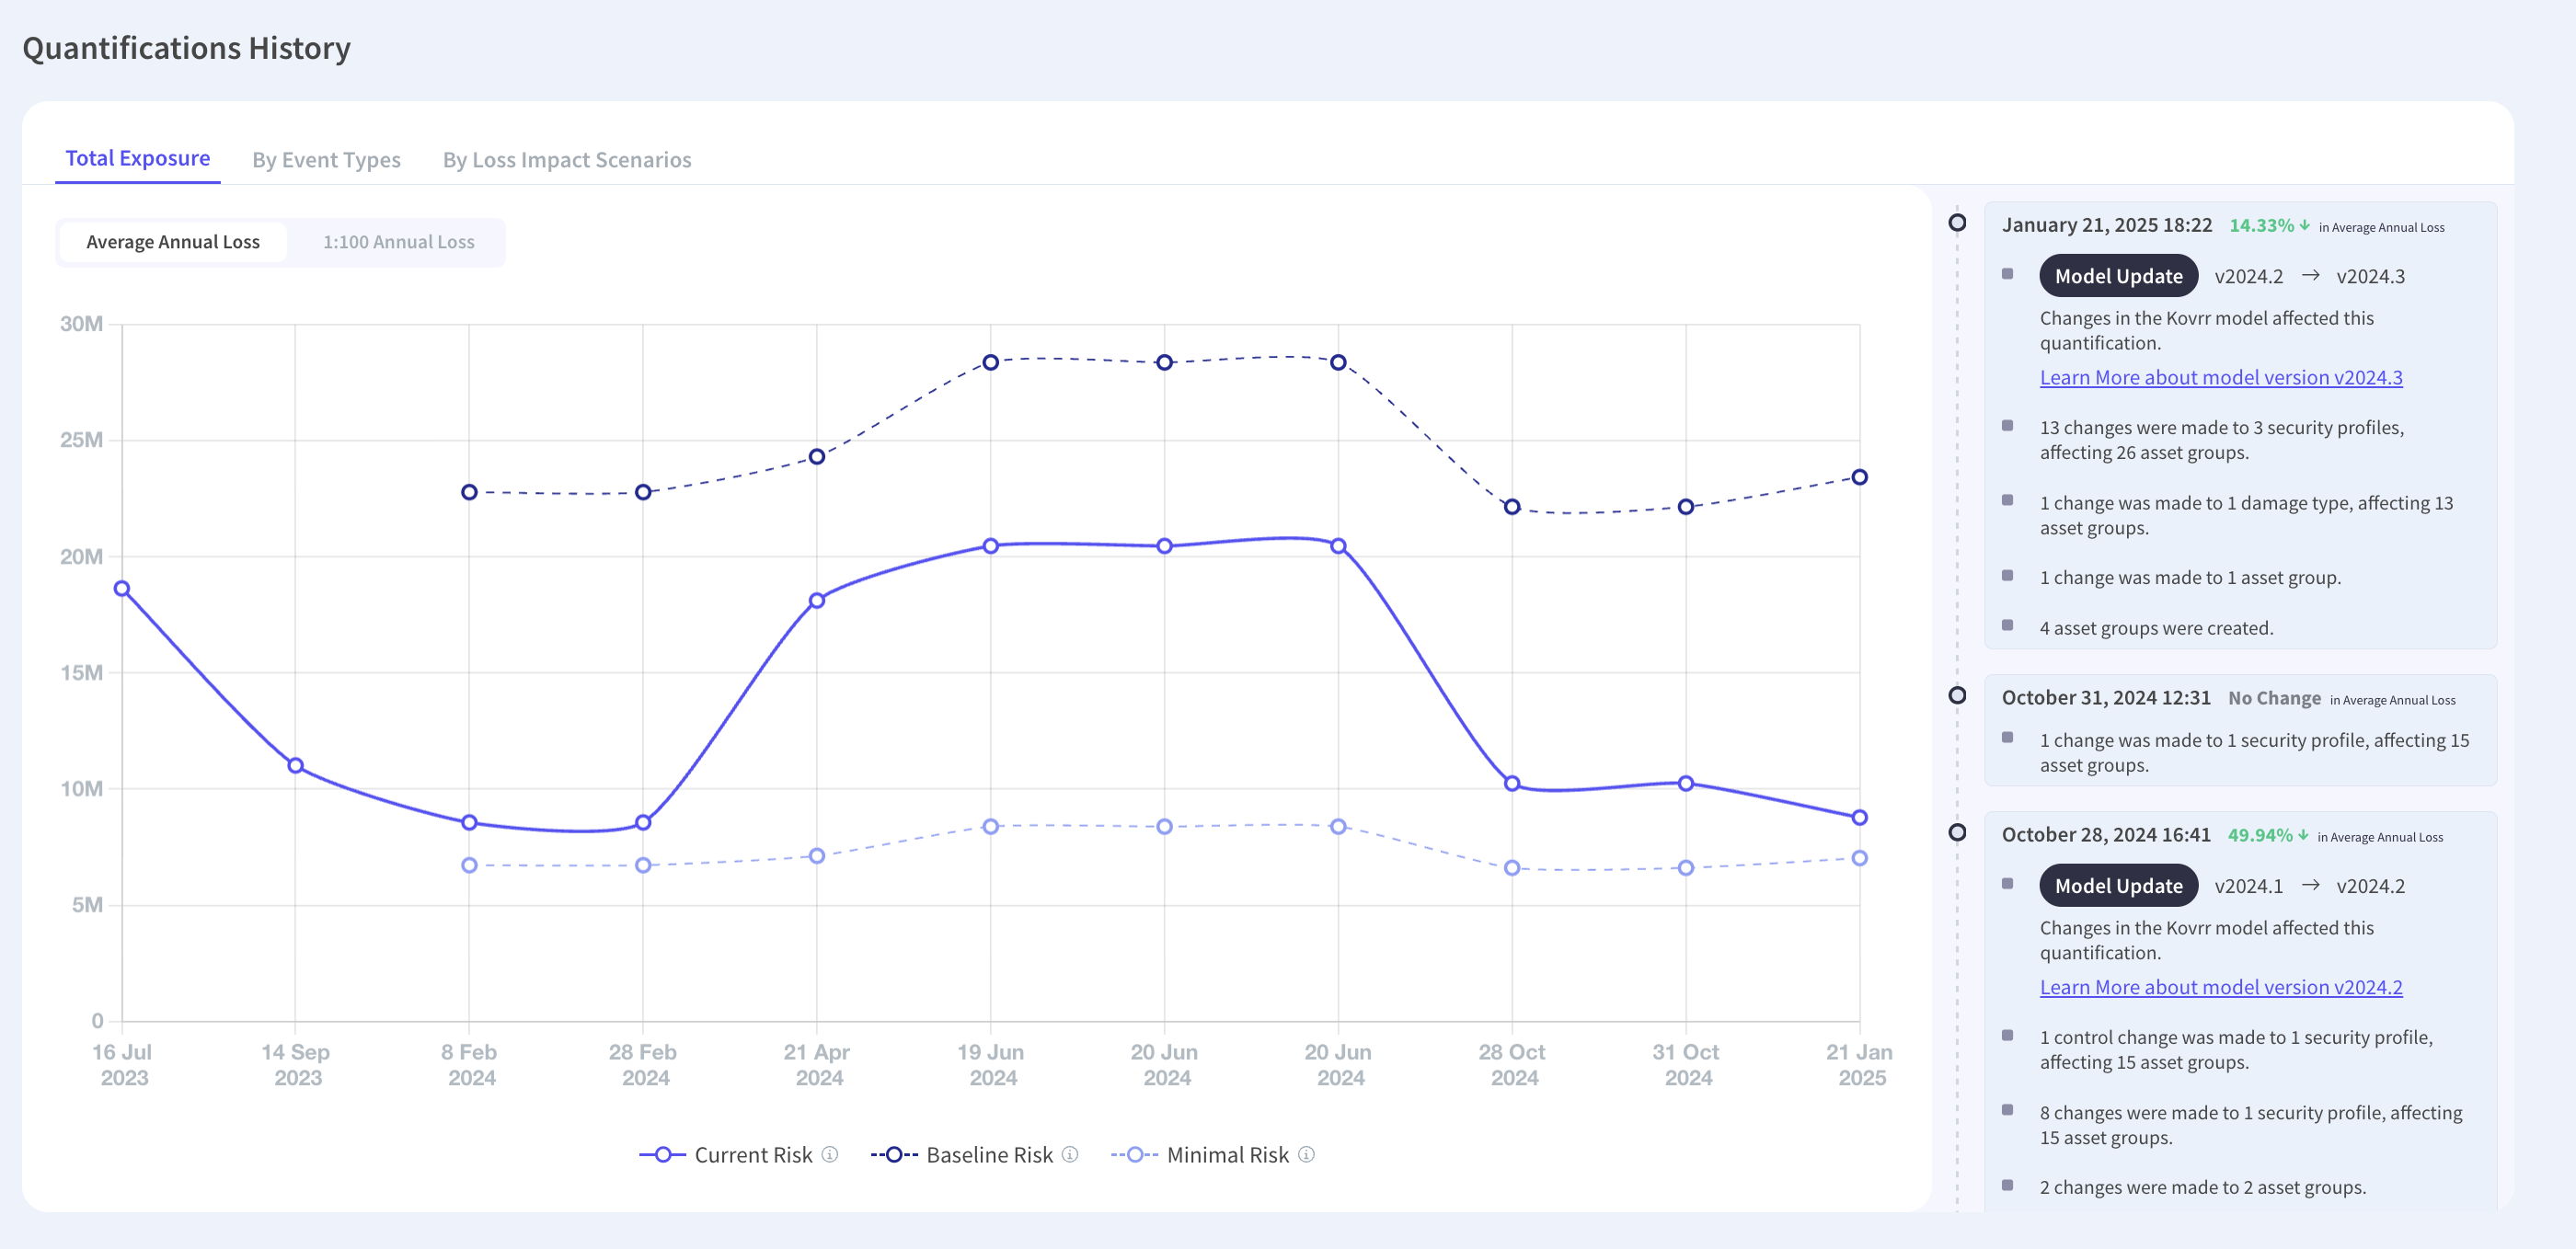
An exposure figure from before the spend and one from after, produced by the same method with the differences between them attributable to specific changes. A figure recalculated on a revised model proves nothing about the controls.
Why the Change Log Matters
Exposure moves for reasons other than control investment, including acquisitions, new systems and model updates. Recording what changed between assessments is what allows a reduction to be credited to a control rather than to an accounting difference.
What Happens Without It
Last year's spend is defended with activity rather than outcome, which works once. Calculating return on a security investment needs the before figure to have been recorded before, which is a decision made a year earlier.
What Should the Ask Look Like?
Three tiers with the line drawn by the board rather than by the security function.
The Tiers
Controls with a strong ratio, controls with a positive ratio closer to the boundary, and controls below the boundary funded for compliance reasons alone. Each tier carries its total and its effect on exposure.
Why Tiers Beat a Number
A single figure can be cut arbitrarily, and the cut lands wherever finance chooses without anybody knowing what it removed. Tiers mean a reduction is a decision about which items go, with the exposure consequence attached to each.
What to Bring to the Room
The ranked list, the do-nothing baseline, and last year's before and after. Budget justification built on prioritized exposure assembles the three from one model, which matters because figures assembled separately rarely reconcile.
What Should Be Established First?
Three things, and the first is the one with a lead time.
A current exposure baseline, because the sequence cannot start without it and producing one takes longer than the budget cycle allows if left until the cycle begins. A cost per candidate control that includes the people to operate it, since license-only costs make every ratio look better than it is. Then last year's starting figure, which either exists or does not and cannot be reconstructed. Cyber risk quantification produces the baseline and the per-control reductions from one model, and the method behind it is documented for anybody who will be asked to rely on the output.
Rank the List, Then Find Where It Stops
Expected loss before a control, minus expected loss after, divided by cost gives a ratio that orders every candidate and identifies where spending stops paying. The ceiling is the part that makes the method credible, since a function willing to say further investment destroys value is believed on everything above that line. Boards ask what happens if nothing is funded, what the last dollar buys and what would be cut first, and a ranked list answers all three by construction while a total answers none. Frequency and magnitude controls both appear in the arithmetic and should stay visible separately, because a portfolio weighted to frequency leaves the tail untouched. Baselining has a lead time, which makes it the task to start before budget season rather than during it.
To see candidate controls ranked by exposure removed per dollar, book a demo with our cyber risk experts.

Cybersecurity Budget Planning FAQs
Speak to an ExpertHow do you build a cybersecurity budget from expected loss reduction?

What questions does a board ask when approving a security budget?
Should a security budget include controls with a ratio below one?
What is the difference between frequency and magnitude controls in a budget?
When should cybersecurity budget planning start?
How do you show what last year's security spend delivered?