
Blog Post
Kovrr’s CRQ Dashboard Upgrade Unifies the Full Picture of Cyber Risk
August 21, 2025
TL;DR
- Kovrr’s CRQ dashboard has been redesigned to present cyber risk insights in an even more logical format that supports faster comprehension and clearer decision-making.
- Foundational indicators such as AAL, 1:100 loss, and event likelihood establish the scale and probability of financial risk across the threat landscape.
- Prioritized recommendations and attack mapping provide depth, helping security teams align mitigation efforts with potential business impact and stakeholder expectations.
- Key risk drivers such as event types and adversary tactics are now easier to interpret, with Drill Down features offering detailed metrics and peer benchmarking.
- New elements like risk positioning, real-world event statistics, and external posture scores bring deeper insight and continuity to the overall risk narrative.
- Final outputs, including board and materiality reports, package the most relevant data for regulators, executives, and decision-makers across the organization.
Structuring Risk Insights Into a Coherent Narrative
With the continuously expanding influence that cybersecurity has in determining an organization's financial and operational resilience, cyber risk quantification (CRQ) has steadily become a foundational component of any robust cyber governance, risk, and compliance (GRC) program. Quantification solutions translate what were once complex metrics into easily understood business terms, helping stakeholders to ensure that cyber initiatives can be more seamlessly aligned with broader business objectives.
As CRQ insights are adopted more broadly, both the usability and applicability of the supporting platform become increasingly important. When risk metrics are presented in business-relevant terms, a wider range of stakeholders, including those outside of cybersecurity, can incorporate them into strategic and operational decisions. Thus, the value of risk quantification lies not only in its analytic rigor but in how clearly it communicates the organization's underlying risk landscape.
With this in mind, Kovrr has introduced a revamped interface and restructured dashboard layout designed to better support that objective. The updated CRQ dashboard surfaces core insights in a more logical sequence, presenting a concise and intuitive view of an organization’s cyber risk exposure. While the core methodology remains unchanged, the updated layout and additional features help users interpret risk not as isolated metrics, but as a cohesive narrative that informs resilience planning.
Framing Risk Exposure Through Core Indicators
Kovrr’s CRQ dashboard presents a curated set of core metrics that guide users through the foundational components of their organization’s cyber risk exposure. These outputs are organized to help stakeholders follow a logical flow that starts with understanding expected and extreme losses, assessing likelihoods, and identifying the most effective mitigation actions. Presented together, these initial indicators provide a cohesive and accessible view of cyber risk that supports faster interpretation and more robust decision-making.
Quantifying Financial Exposure Across the Risk Spectrum
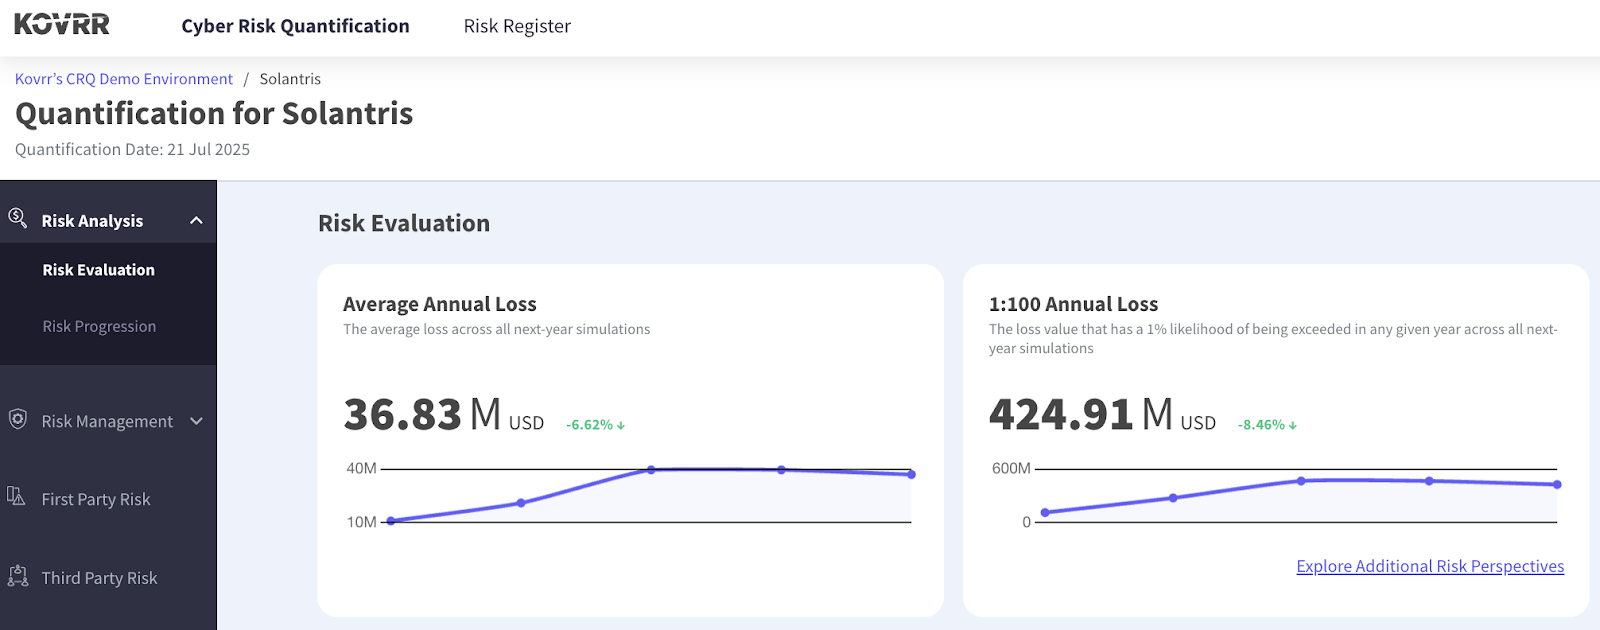
Every story needs a scale. Kovrr’s Risk Evaluation dashboard begins by identifying an organization’s Average Annual Loss (AAL) and 1:100 Annual Loss. AAL describes the expected financial loss stakeholders should be prepared to face in the upcoming year due to digital activities, while the 1:00 figure models the extreme, high-severity loss with a 1% likelihood of occurrence. These metrics help set the stakes, offering immediate context for strategic decisions around investment and risk appetite decisions.
Tracing the Probability of Risk Materialization
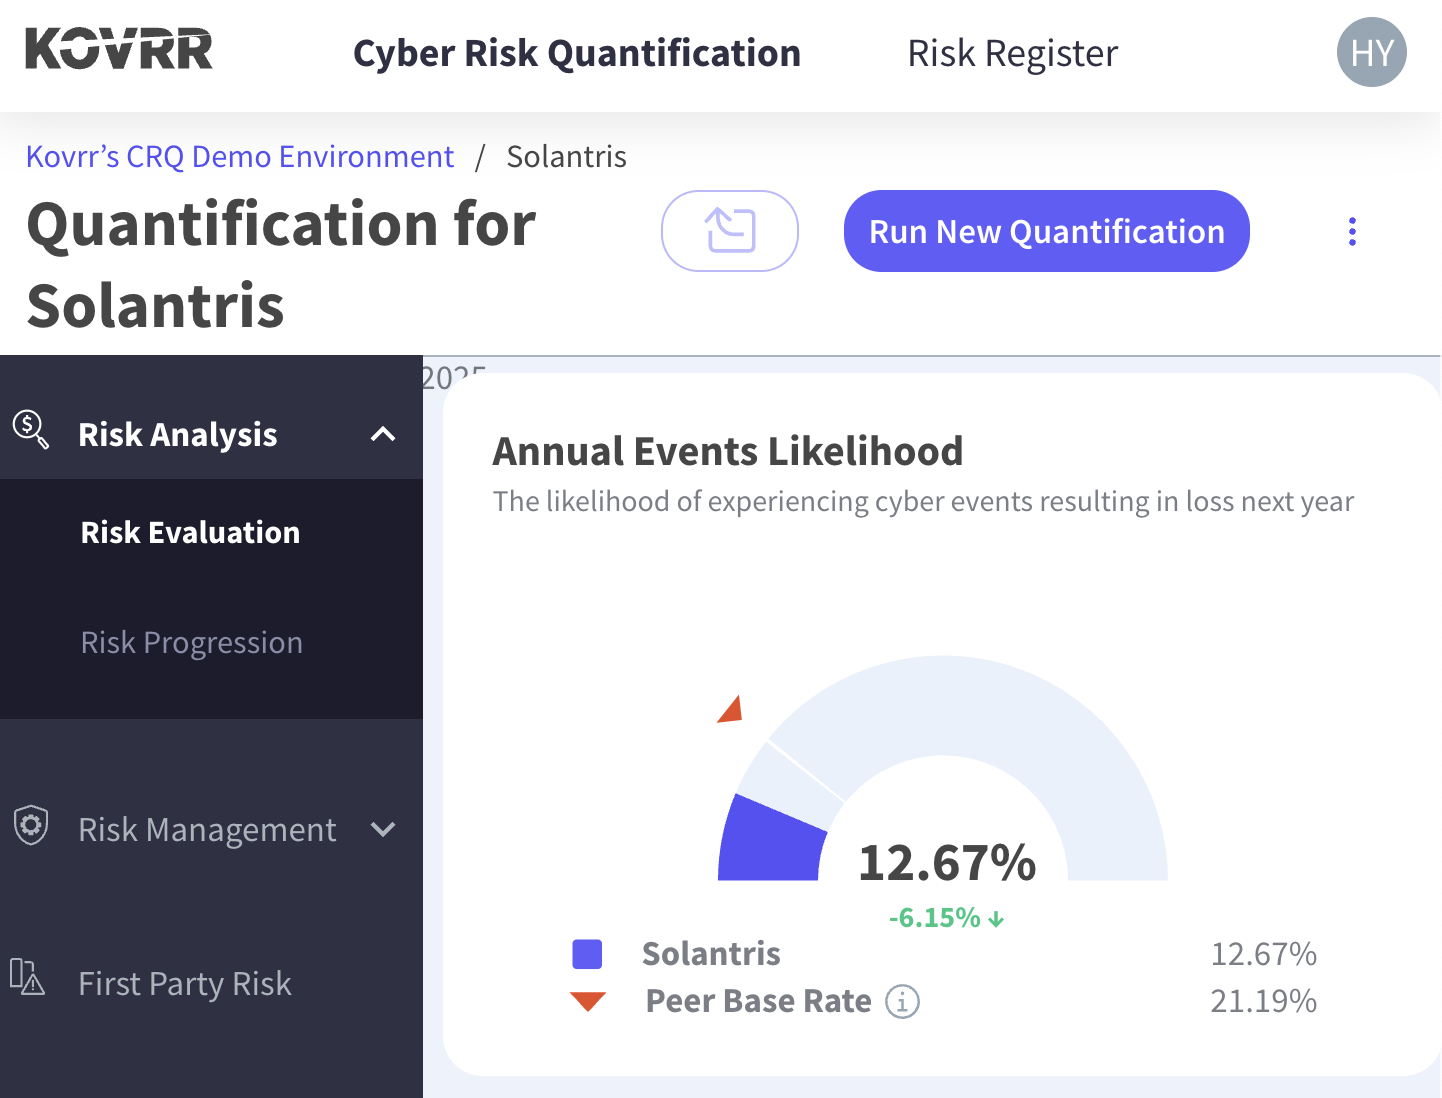
Beyond the magnitude of consequences, understanding cyber risk similarly requires insight into the probability of those losses occurring. The Annual Events Likelihood metric quantifies that likelihood, determining the annual chance that at least one financially significant cyber incident will take place within the next 12 months. Presented alongside relevant industry benchmarks, this indicator offers more critical context regarding how the organization's exposure compares to peers and supports decision-making around mitigation urgency.
Prioritizing Action Through Quantified Recommendations
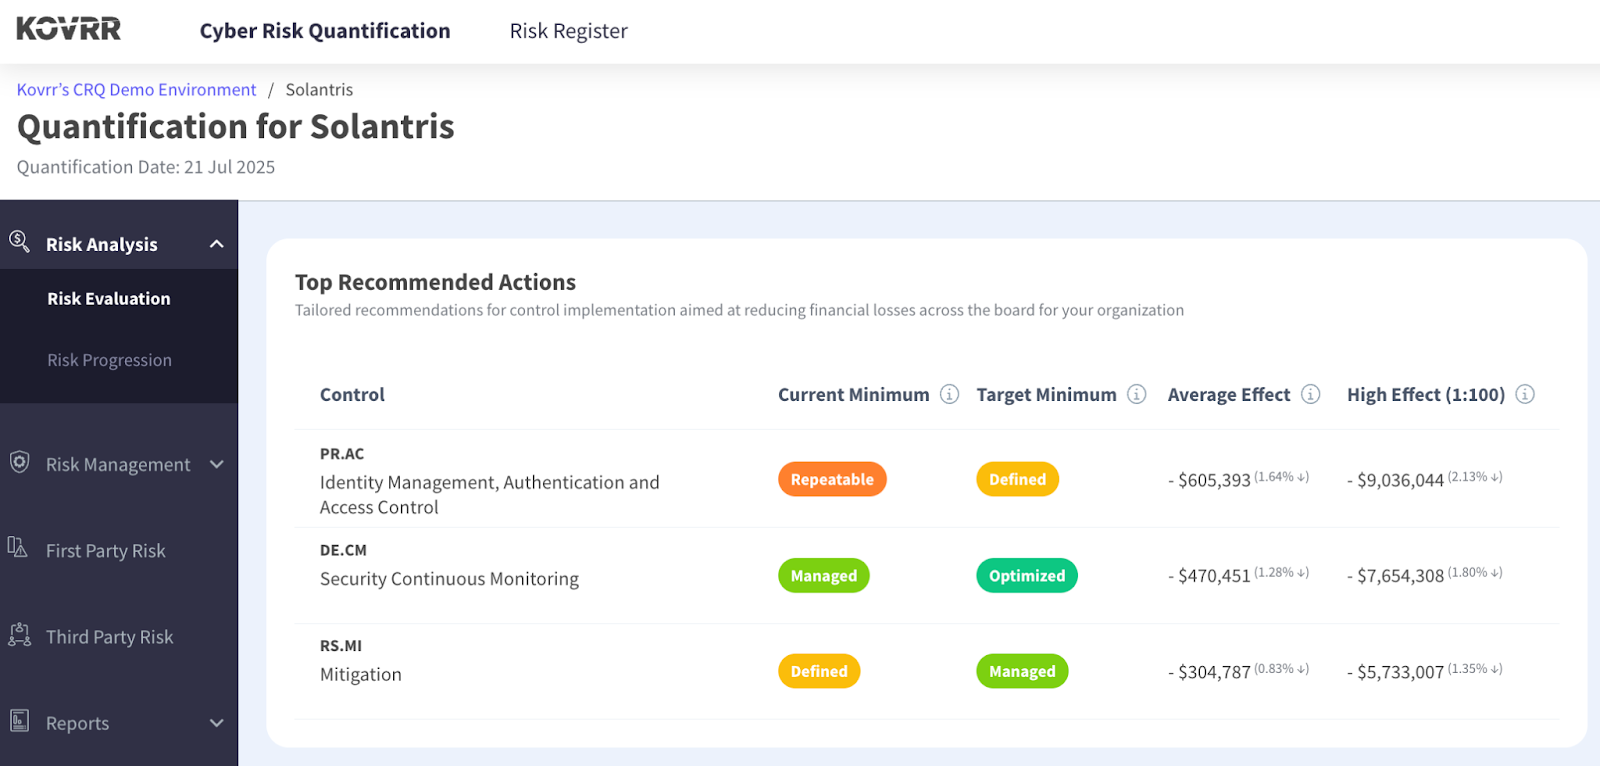
Effective cyber risk management and optimization of limited resources hinges on identifying which initiatives will produce the highest measurable impact. After the quantification has run, Kovrr’s platform automatically organizes a list of security control recommendations, prioritized according to their expected reduction in financial exposure under both average and severe conditions. By linking these suggestions directly with the maturity target, the view empowers stakeholders to be able to justify investment decisions with data-driven confidence.
Identifying the Incidents and Adversary’s Tactics
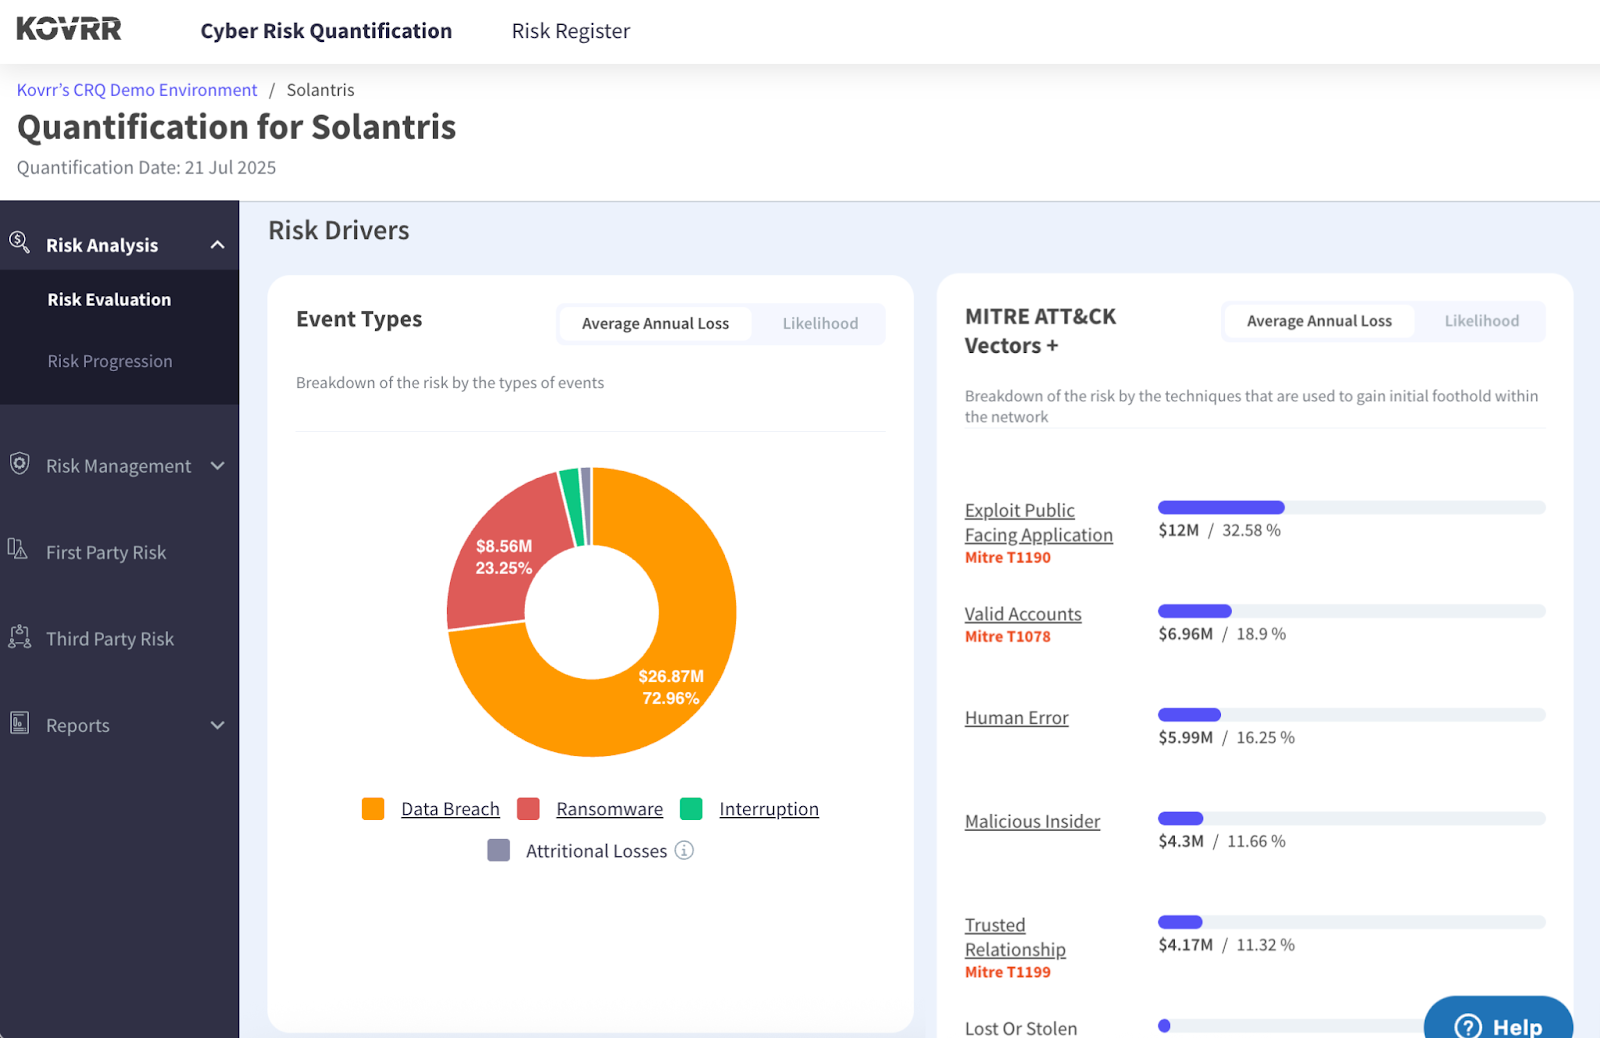
No cybersecurity narrative is complete without explicitly outlining how the risk manifests, both in terms of attacker behaviors and the organizational consequences. The Event Types breakdown shows the categories of events, such as ransomware, business interruption, or data breaches, that drive financial exposure. In parallel, the MITRE ATT&CK Vectors+ highlights the entry points that contribute most to the AAL. Both, likewise, are broken down by their likelihood of occurrence, offering clarity on where threats are coming from and how they might manifest.
With the Drill Down capability, users can explore any event type or initial attack vector in greater depth, viewing targeted loss metrics, control recommendations, and peer benchmarks specific to that risk driver. This added layer of detail supports more focused mitigation planning and clearer communication with business stakeholders.
New Enhancements to Strengthen the Story Your Risk Data Tells
Deepening the value of cyber risk quantification, Kovrr has introduced a series of new elements to the Risk Evaluation dashboard that make the risk narrative even more accessible and compelling. By bringing this information to the forefront of the platform and arranging it in a more intuitive sequence, it’s easier for users to understand how risk originates, how it progresses across the organization, and how it ultimately results in financial and operational impact.
Positioning Risk in Context
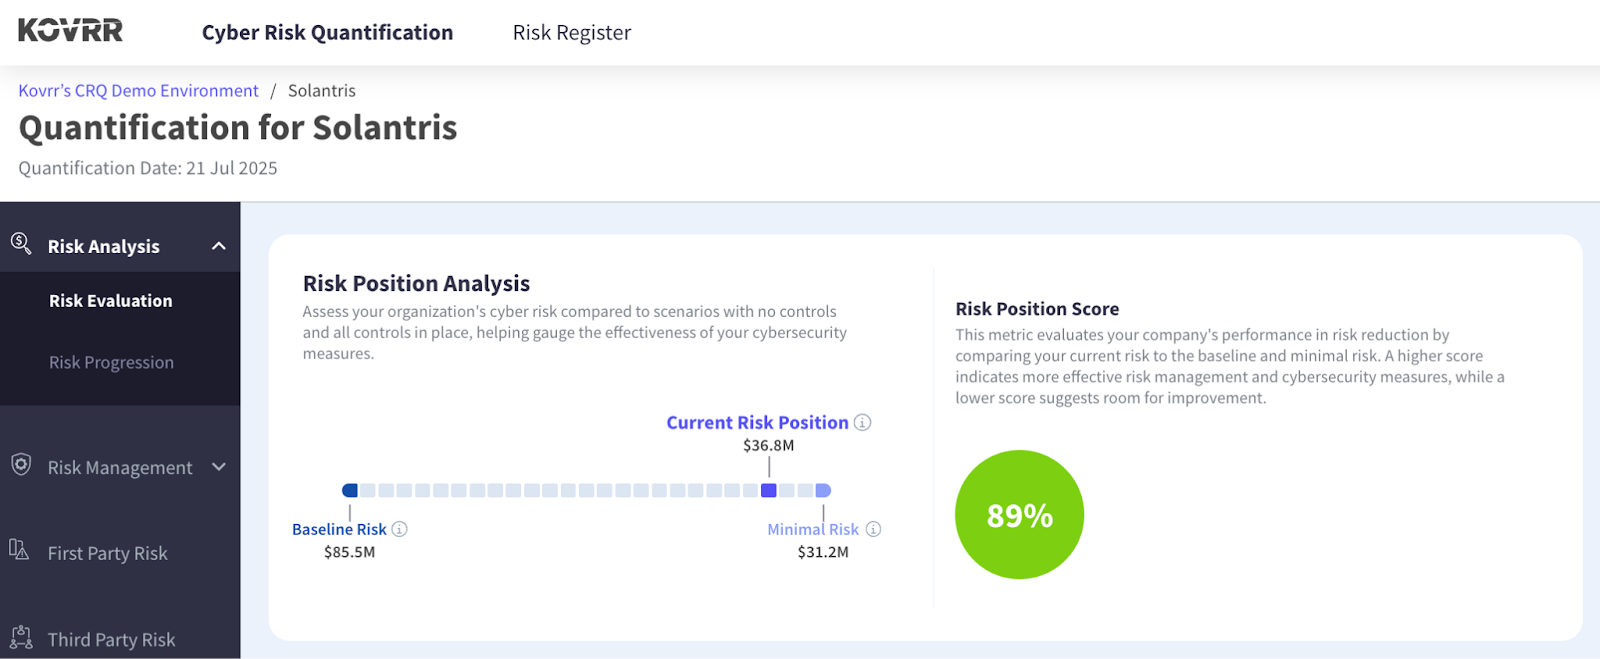
The Risk Position Analysis introduces another solid reference point for interpreting financial exposure due to cyber risk. By placing the organization’s current risk level between a baseline example with no security controls in place and a minimal-risk scenario in which controls have reached their fullest maturity, the dashboard illustrates how much loss has already been avoided, as well as how much risk reduction remains possible.
The Risk Position Score quantifies this posture, offering stakeholders a trackable benchmark that reflects program effectiveness and supports goal setting and performance tracking over time, as outlined in the full explanation of Kovrr’s Risk Position methodology.
Bringing Loss Scenarios and Cost Categories Forward
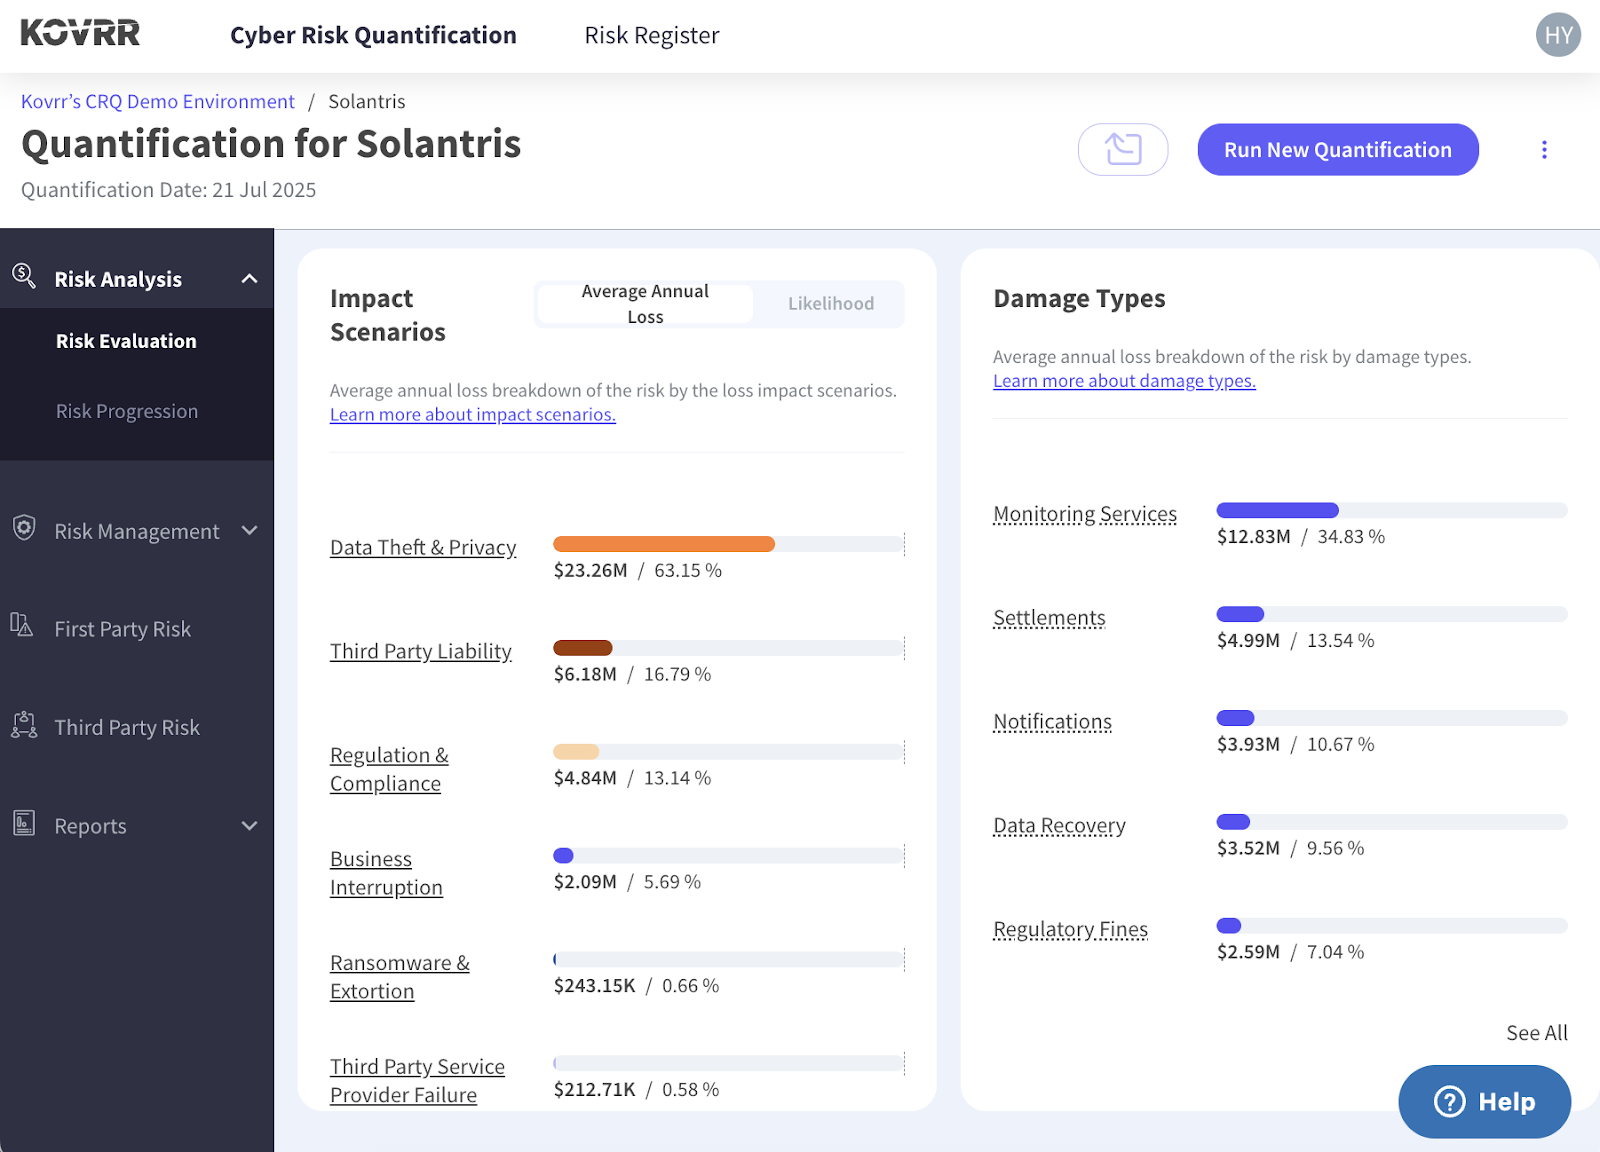
The upgraded dashboard brings the Impact Scenarios and Damage Types breakdown into immediate view. The former reveals which type of incident, such as a data theft, third-party liability, or regulatory exposure, drives the most financial loss. The latter then determines how those losses are broken down. For instance, some organizations may end up paying more on settlements, while others have larger regulatory fines. By bringing both of these panels forward in the interface, Kovrr is helping teams to connect cause to consequences.
Calculating the Real-World Toll of Cyber Events
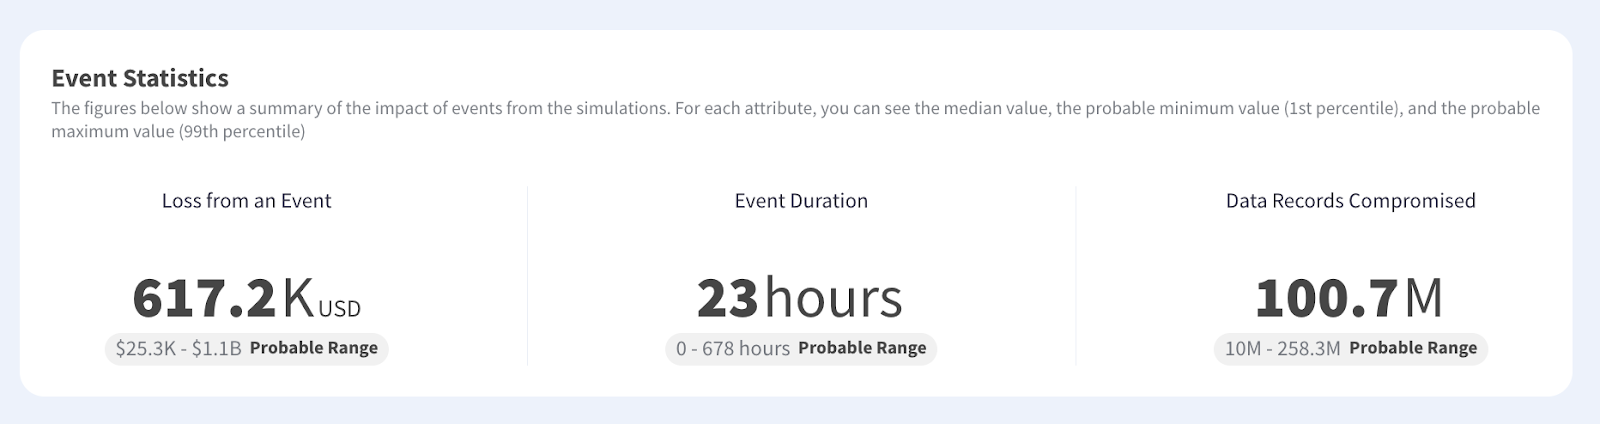
The Event Statistics section adds a new dimension to the risk picture by highlighting how cyber incidents might unfold in practice. Median values for financial loss, downtime, and number of data records compromised offer stakeholders a grounded perspective on what their organization might face if they were to suffer from a risk that causes loss. The Event Statistics transform the cyber exposure narrative into one that is relatable and concrete, ensuring users understand what events will actually cost the business.
Surfacing Exposure Through Security Signals
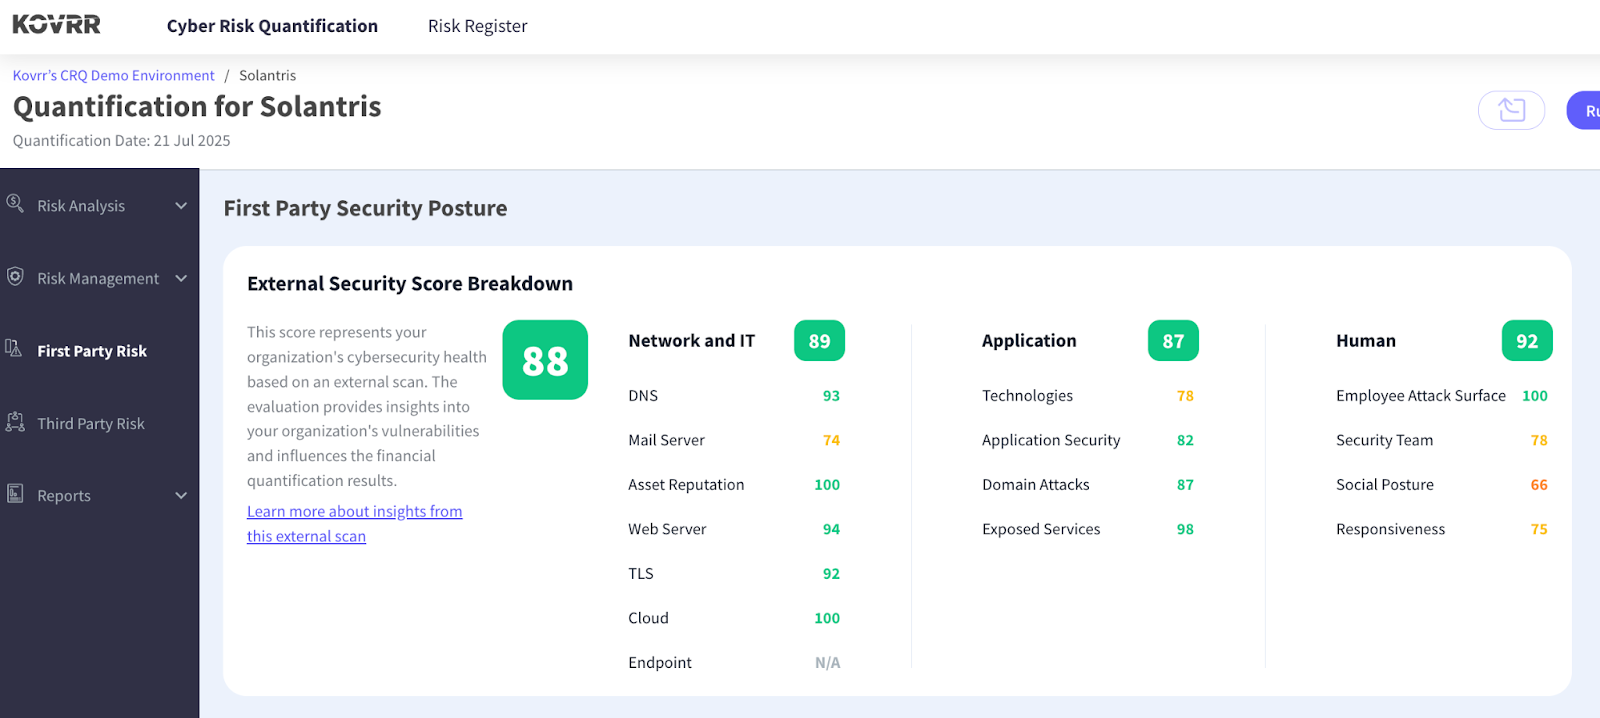
The First Party Security Posture introduces a slew of new data points to the platform by running an external scan-based assessment of the organization's cyber hygiene. The scan identifies findings across a range of technical and human-facing domains, which are then aggregated into three categories: Network & IT, Application, and Human. Each is scored independently, providing a quantitative view of exposure based on observable conditions.
The First Party Security posture scores feed into Kovrr's broader quantification model by influencing the likelihood of a risk materializing. A low score, for instance, reflects a larger surface for threat exploitation, while a higher score indicates minimized exposure. This new section allows teams to contextualize external risk signals with the larger cyber risk narrative, where prevention posture and loss potential are no longer viewed in isolation.
From Metrics to Messaging
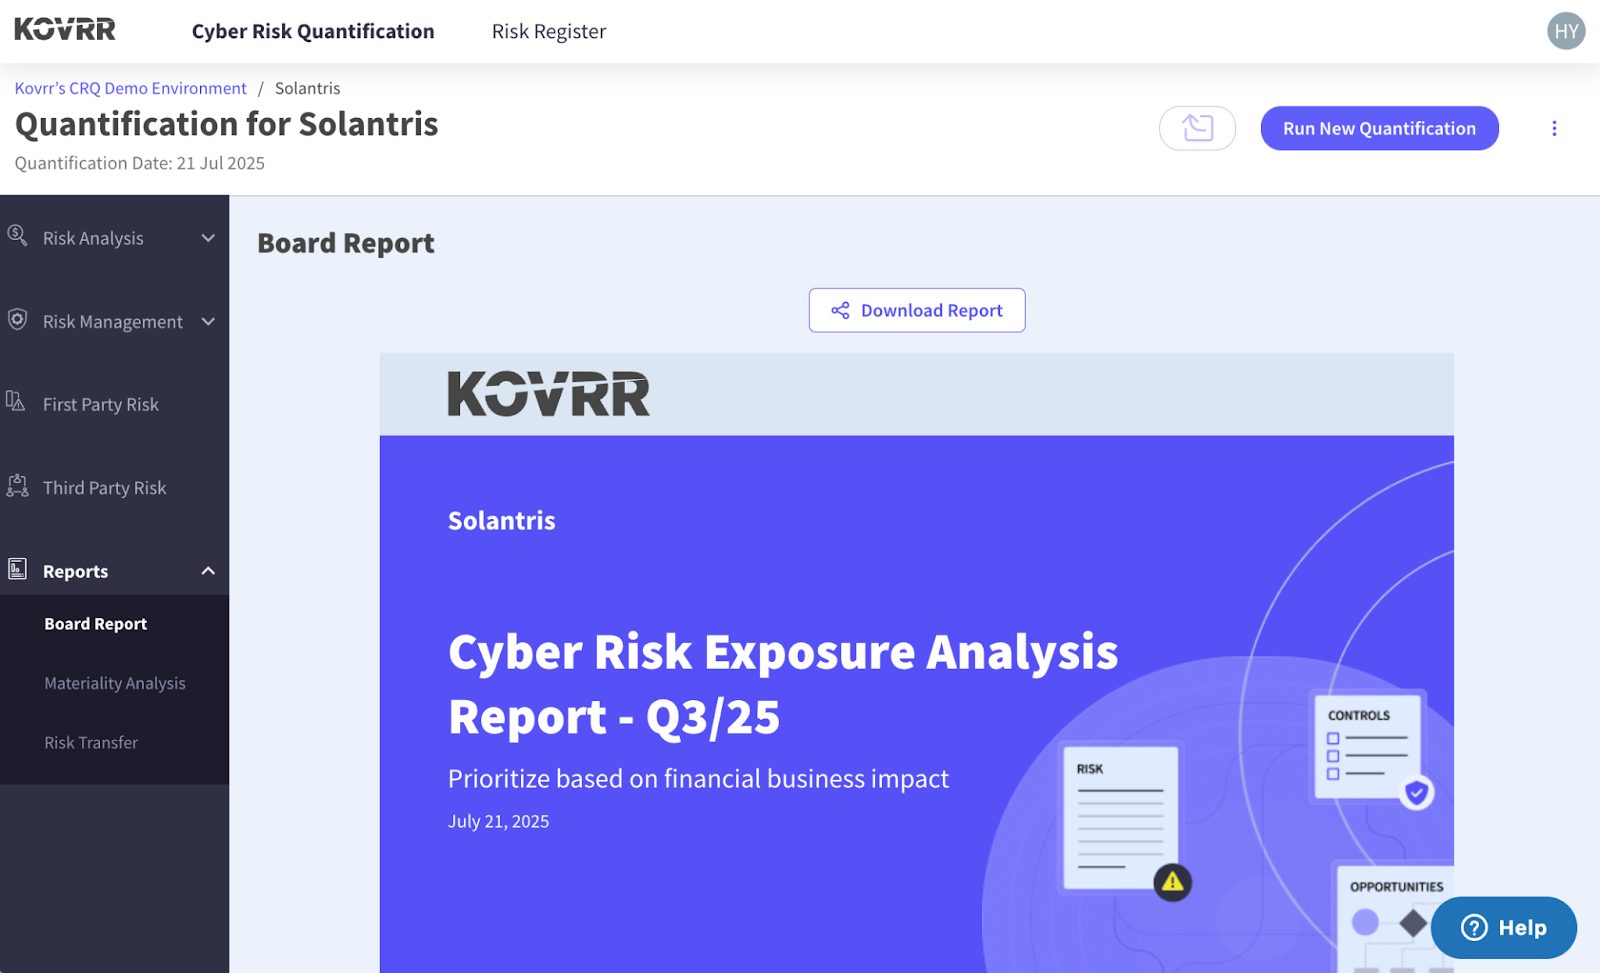
After quantifying an organization’s potential loss exposure, identifying high-impact risk drivers, and assessing mitigation opportunities, Kovrr’s upgraded dashboard compiles findings into business-aligned documentation. A suite of exportable, tailored reports, including, but not limited to, the board report, materiality analysis, and risk transfer summaries, packages the most relevant findings into formats fit for regulatory reporting and executive briefings, supporting consistent, data-backed communication across business units, risk committees, and oversight bodies.
Platform Built for Decision-Makers
The enhanced CRQ dashboard was redesigned to emphasize Kovrr's core objective of making cyber risk intelligence actionable across business functions. With reordered key metrics and new components moved to the forefront, the platform supports faster comprehension and more confident communication. Indeed, every element has been structured to reflect the full context in which cyber events unfold, no longer presenting dimensions in isolation but as independent components of a unified risk model.
Moreover, the heightened level of clarity and cohesion strengthens collaboration between technical teams, executive leaders, and oversight bodies. Cyber risk can be evaluated, discussed, and acted on without the need for complicated translations, and when it's time to report outward, the relevant information is already packaged and aligned with strategic intent. On top of increased visibility, stakeholders get a cyber risk quantification solution that seamlessly helps them make real-world decisions that build resilience.
To explore the updated CRQ platform and see how it supports your organization’s risk and resilience objectives, schedule a free demo with one of our cyber risk management experts today.
.webp)
.jpg)
.jpg)
.jpg)
