.jpg)
Blog Post
Scenario-Based Cyber Risk Quantification: Modeling What Matters Most
July 23, 2026
Scenario-based cyber risk quantification (CRQ) calculates the financial impact of specific cyber incidents in real dollars, one modeled scenario at a time, rather than producing a single blended exposure number for the whole organization. Instead of asking "what is our cyber risk," it asks "what happens financially if a ransomware group encrypts our ERP, if a third-party service provider goes down for five days, or if a nation-state actor exfiltrates our customer database." Each scenario is scoped into a specific asset, threat, and impact, then modeled probabilistically to produce a financial output the board and CFO can act on.
This approach turns cyber risk into a portfolio of comparable exposures rather than a single opaque number. Security teams use scenario modeling to prioritize where to invest first, insurance teams use it to set defensible coverage limits, and boards use it to understand which specific events would materially damage the business. This article covers what scenario-based CRQ is, the anatomy of a well-scoped scenario, how the modeling process works, how to prioritize across competing scenarios, and where scenario modeling most often goes wrong.
What Scenario-Based Cyber Risk Quantification Is
Scenario-based CRQ is a modeling approach that decomposes cyber risk into specific event narratives and quantifies each one financially. It sits on top of a broader cyber risk quantification engine and produces outputs that answer questions aggregate quantification cannot.
How Scenario Modeling Differs From Aggregate CRQ
Aggregate CRQ produces one number for total organizational exposure. Scenario-based CRQ produces a distinct financial estimate for each scoped scenario, letting the security team compare a ransomware attack on core infrastructure against a data breach in a customer-facing system against a third-party outage. Aggregate quantification tells the board the total. Scenario modeling tells the board where the total comes from and which specific events would move the number materially.
Why Scenario Modeling Wins Board Conversations
Boards struggle with abstract risk. They engage with specific stories. A quantified scenario like "a ransomware attack on the primary ERP cloud server would cause a five-day outage and $8.2 million in Average Annual Loss impact" is a conversation. A qualitative "high" rating on the same event is not. Scenario modeling gives the CISO the narrative structure to walk the board through cyber risk one story at a time, which is how board-level cyber conversations get real traction.
The Anatomy of a Cyber Risk Scenario
Every quantified scenario is built from three essential components. Get any of them wrong, and the model produces numbers that will not survive scrutiny.
The Asset
The specific target inside the organization. This might be a core database, a customer-facing cloud platform, a manufacturing OT environment, intellectual property, or a source code repository. The asset needs a business value attached, not an IT replacement cost, since scenario modeling produces business-impact numbers rather than infrastructure-cost numbers.
The Threat
The actor and method. An external ransomware group, a nation-state actor, a malicious insider, a supply chain compromise through a third-party service provider, or an accidental exposure by an internal user. Threat scoping matters because frequency inputs vary dramatically by threat type, and calibrating the wrong threat produces a model that misses the real exposure.
The Impact
The immediate consequence of the event. Encryption of data, service downtime, data exfiltration, physical safety impact in OT environments, or reputational damage. Impact scoping determines which loss magnitude categories the model has to run, since a ransomware encryption event produces different downstream costs than a data theft event.
A fully scoped scenario reads like: "An external ransomware group deploys encryption on the primary ERP cloud server, causing five days of operational outage and downstream regulatory notification obligations." That single sentence contains the asset, the threat, and the impact, which is enough to feed a defensible quantification.
How the Scenario Modeling Process Works
Once the scenario is scoped, four modeling steps produce the financial output. Each step draws on different data sources and different modeling techniques.
Scenario Scoping
Teams start by examining the organization's digital footprint and identifying the scenarios most relevant to its threat profile, asset landscape, and industry. Custom scenario builders let security and risk teams define scenarios that reflect the specific environment rather than relying on generic templates. Kovrr's Top 9 Cyber Loss Scenarios year-in-review offers a starting library of common enterprise scenarios worth benchmarking against.
Frequency Estimation
The next step estimates how often this specific event could occur in a given year. Analysts pull historical incident data, internal control telemetry, threat intelligence feeds, and industry-specific benchmarks to build a defensible frequency estimate. Continuous control monitoring keeps frequency estimates aligned to the current control posture rather than the posture at the last assessment.
Loss Magnitude Modeling
Once frequency is estimated, the model calculates the full range of downstream financial impacts if the event occurs. This is where scenario modeling produces its highest-value outputs, because it decomposes the total loss into the specific cost categories a CFO recognizes. Every scoped scenario runs losses across four downstream buckets:
- Detection and escalation. Forensic investigation, incident response consultants, internal security team overtime, and the immediate technical containment work in the first days after the event.
- Notification. Regulatory reporting, legal notice to affected customers, law enforcement coordination, and the operational cost of running notification workflows at scale.
- Post-breach response. Regulatory fines, litigation costs, ransomware extortion payments where applicable, and the remediation work that continues for months after the event.
- Lost business. Long-term revenue impact from customer churn, canceled contracts, higher insurance premiums at the next renewal, and the operational disruption that lingers well past the initial incident.
Probabilistic Simulation
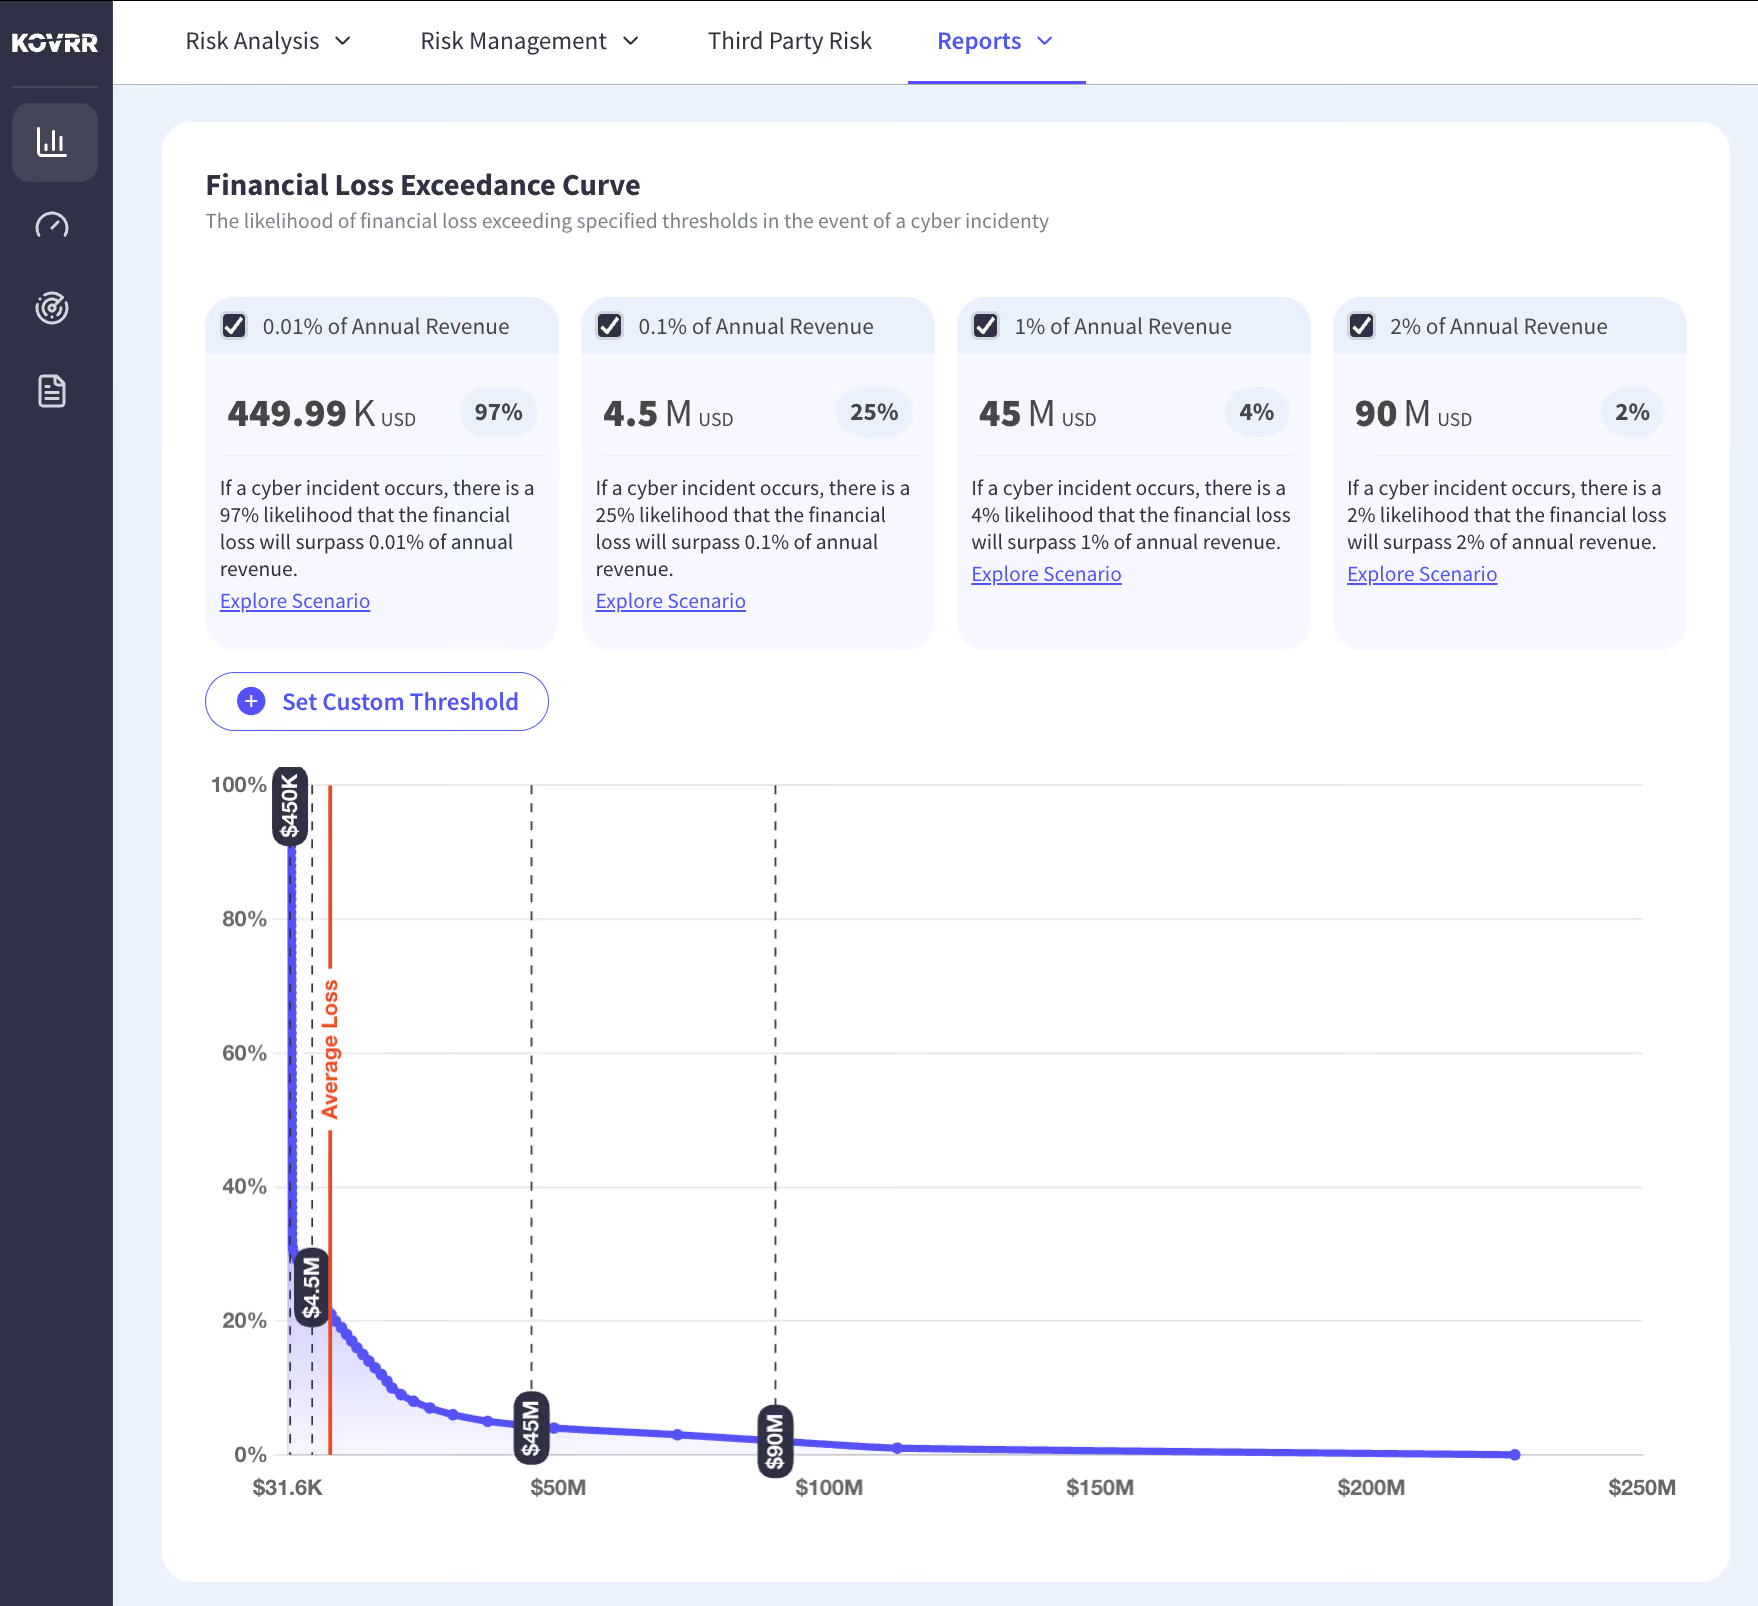
Rather than producing a single point estimate, the platform runs the scenario through thousands of Monte Carlo trials against the calibrated frequency and loss magnitude distributions. Kovrr's engine runs 25,000 trials per quantification, producing a full Loss Exceedance Curve for the scenario. The output is a range with probability weightings attached to every point in that range, which is what lets the model support both expected-value reasoning and tail-risk analysis.
Using Scenarios to Prioritize Where to Focus First
Once multiple scenarios are quantified, they can be compared like line items on a balance sheet. Three prioritization angles cover most enterprise decision-making needs.
Rank by Financial Exposure
The most direct approach. Order scenarios by Average Annual Loss and 1:100 tail exposure, then invest in the controls that reduce the highest-exposure scenarios first. This is the ranking that answers the CFO's question of where the money is at risk.
Rank by Control Investment ROI
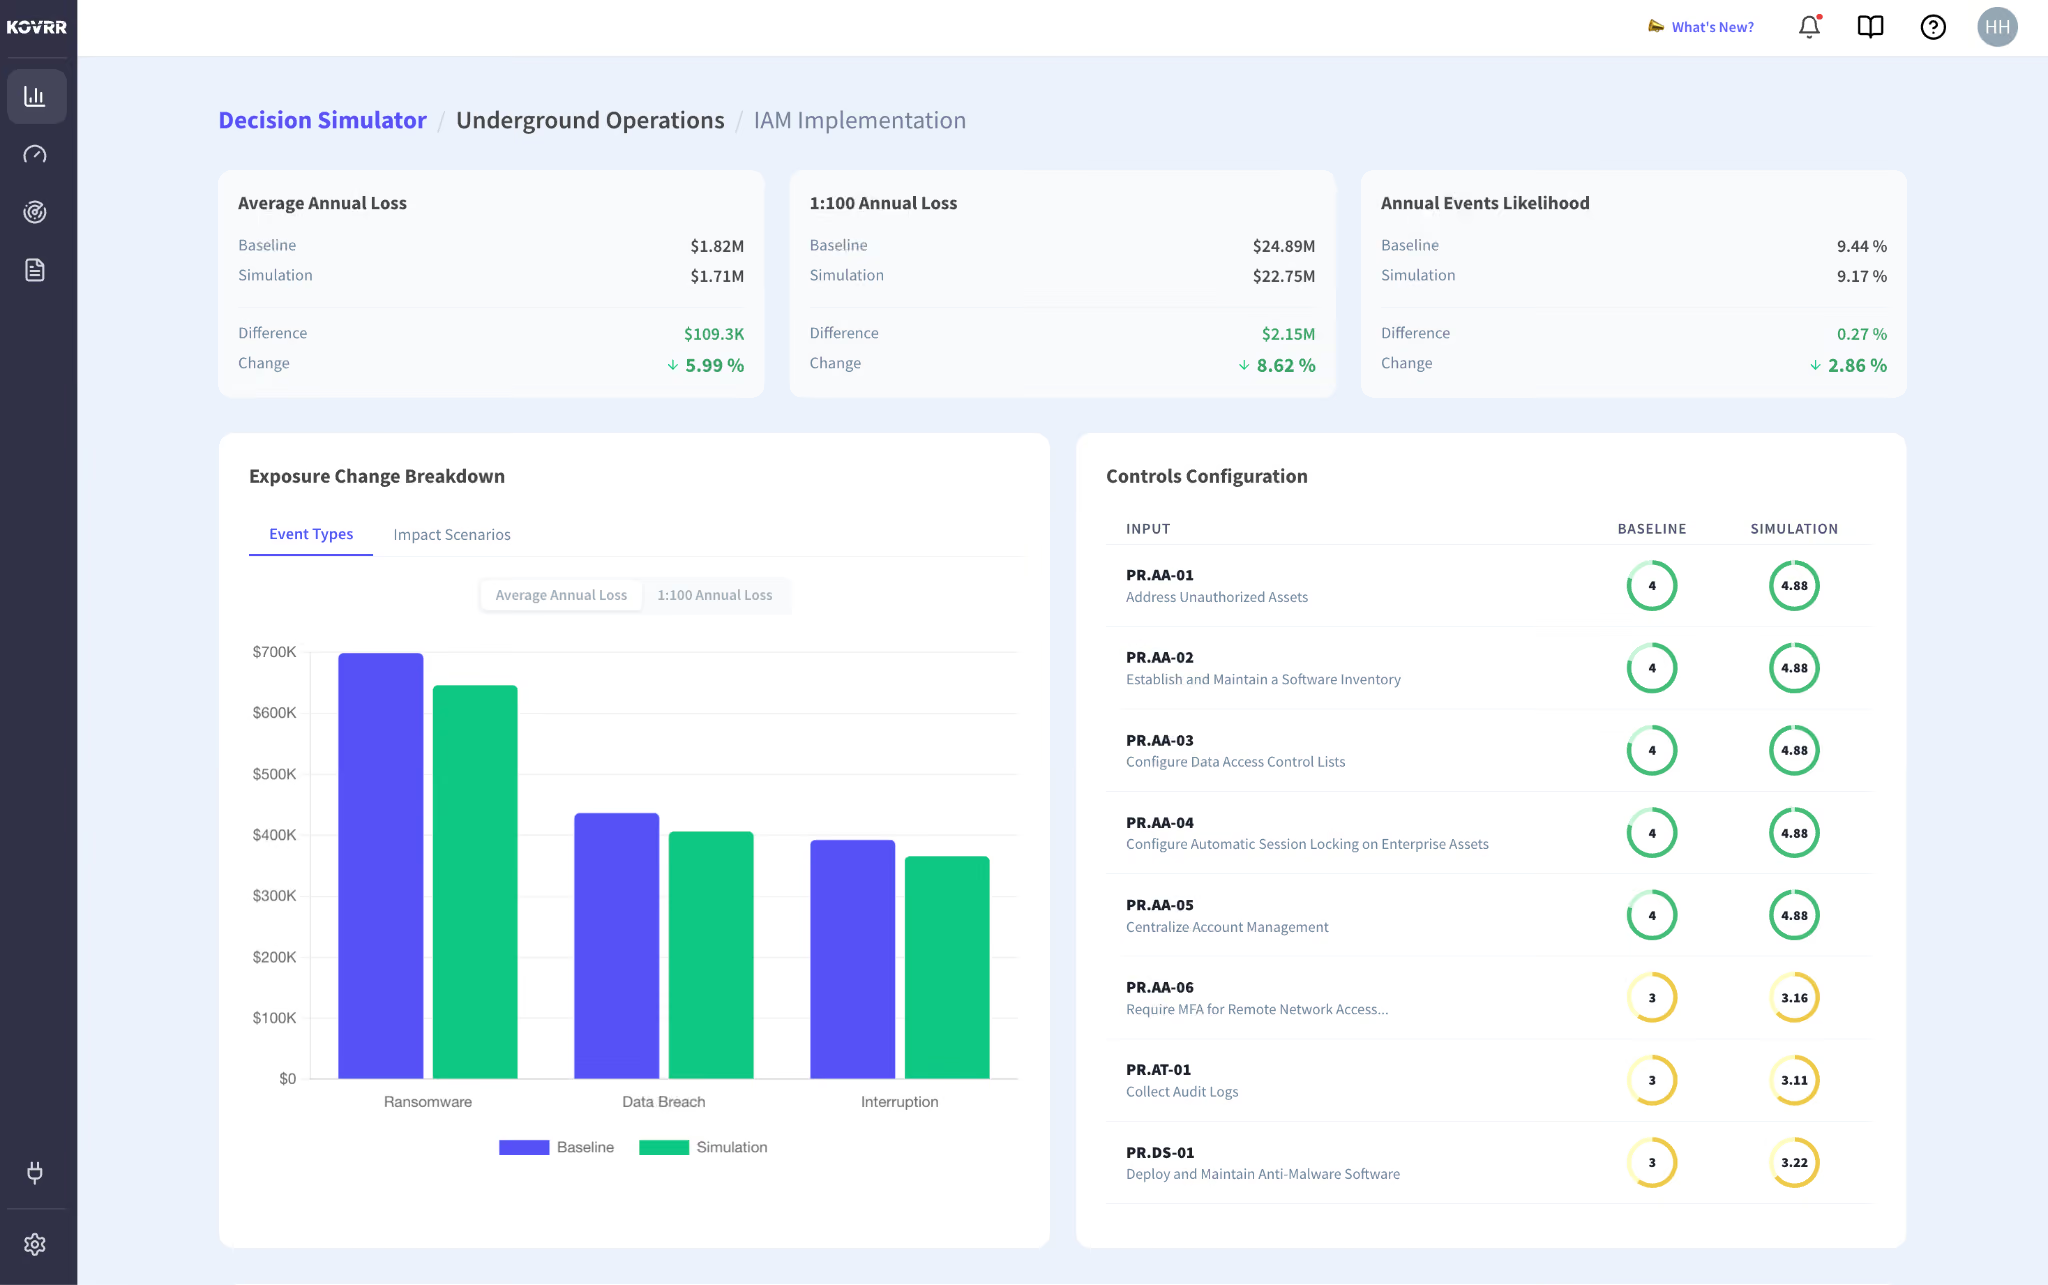
Financial exposure alone does not tell the whole story. The Decision Simulator compares proposed control investments against the AAL reduction each would produce, letting security teams sort by dollar-for-dollar risk reduction rather than raw exposure. A scenario with lower total exposure but a high-ROI mitigation path often deserves budget ahead of a scenario with higher exposure but limited control options.
Rank by Regulatory or Insurance Impact
Scenarios that cross material loss thresholds trigger SEC disclosure obligations, and scenarios in the tail drive cyber insurance coverage optimization decisions. Ranking scenarios by their disclosure and insurance implications surfaces the ones that carry regulatory or financial exposure well beyond their direct loss estimate.
The Kovrr Scenario Modeling Capabilities
Enterprise CRQ platforms differ substantially in how they support scenario work. Kovrr's platform ships dozens of scenario-modeling capabilities out of the box, including:
- Scenario Intelligence. Pre-built and custom scenarios with automated frequency and loss magnitude modeling drawn from carrier-grade incident data.
- Decision Simulator. What-if modeling that compares scenarios under different control investment paths, showing AAL reduction per dollar spent.
- Top-Down Scenarios. Enterprise-wide stress testing for catastrophic events, useful for board-level worst-case conversations and regulatory disclosure preparation.
- High-Risk Scenario Identification. Automated flagging of the scenarios with the highest tail exposure or the greatest sensitivity to specific control weaknesses.
The combination lets security, finance, and insurance teams work from the same scoped scenarios, which is how scenario modeling stays useful across the full risk workflow rather than becoming an isolated modeling exercise.
Common Scenario Modeling Pitfalls
Failed scenario modeling programs follow predictable patterns. Watch for these before they hollow out the discipline:
- Overly generic scoping. Scenarios that read like "a data breach" or "a ransomware attack" without an asset, threat, and impact will produce fuzzy outputs no one trusts. Every scenario needs the three-part structure.
- Static frequency inputs. Using industry averages once and never refreshing them means the model drifts as the control environment changes. Frequency inputs need continuous recalibration.
- Ignoring the lost business bucket. Long-term customer churn and canceled contracts are the largest cost category in most scenarios and the one most often left out of the model.
- Modeling scenarios in isolation. Real cyber events cascade. A single ransomware attack often triggers regulatory notification obligations, third-party service disruption, and insurance implications. Scenarios that model only the initial event understate the true exposure.
- Treating scenario modeling as an annual exercise. Threat data, controls, and asset criticality all move throughout the year. Scenarios modeled once and shelved are stale within a quarter.
From Scenarios to Board Decisions
Scenario-based cyber risk quantification is what turns cyber risk from an abstract number into a portfolio of specific events the board can act on. When the CISO can walk into a board meeting with the top five scenarios ranked by financial exposure, the top five ranked by control ROI, and a clear view of which ones cross material disclosure thresholds, the conversation stops being about "how much risk do we have" and starts being about "which of these do we address first."
Organizations ready to see their own quantified scenarios modeled against their environment and control posture can schedule a demo to see Scenario Intelligence, Decision Simulator, and quantified loss distributions run against their own data.

Scenario-Based CRQ Modeling FAQs
Speak to an ExpertWhat is scenario-based cyber risk quantification?

How is a cyber risk scenario scoped?
What loss categories should a cyber scenario model cover?
How does scenario modeling support cyber insurance decisions?
How many scenarios should we model?
How often should scenarios be refreshed?