
Blog Post
How to Quantify Cyber Risk Effectively: A Practical Enterprise Guide
August 3, 2026
Effective cyber risk quantification means moving past subjective heatmaps and translating technical vulnerabilities into dollar-denominated loss exposure and probability distributions that the CFO, board, and cyber insurance underwriter can act on. It is the discipline that turns cyber from a technical cost center into a strategic risk portfolio managed alongside every other category of enterprise exposure.
Cyber risk quantification (CRQ) has moved from an emerging practice to a documented requirement under SEC disclosure rules, DORA in financial services, and every serious board-level cyber conversation, which is why the question of how to do it well has become one of the highest-value operational questions in enterprise security.
This article covers why effective CRQ requires more than picking a framework, the four-step enterprise playbook that produces defensible output, the core mathematical models CRQ programs use, how to choose between FAIR, NIST SP 800-30, and actuarial-grade approaches, what distinguishes effective CRQ from compliance CRQ, and the common traps that keep programs from delivering the strategic value the discipline was built for. For the definitional foundation of what CRQ is, Kovrr's guide to what cyber risk quantification is covers the underlying methodology and vocabulary in more depth.
Why Effective CRQ Requires More Than a Framework
Buying a framework and running through its checklist is the most common failure mode in enterprise CRQ. Frameworks describe the shape of the discipline. They do not, on their own, produce the defensible dollar figures the CFO and board need to make investment decisions or the audit trails regulators expect during material incident disclosure.
Effective CRQ requires four things a framework alone does not provide. Actuarial-grade data anchors frequency and severity distributions against real-world claims outcomes rather than internal history alone. Probabilistic modeling with sufficient statistical significance produces stable output across reruns of the same scenario. Continuous integration with security telemetry keeps the numbers current as controls and threats evolve.
Direct connection to the broader enterprise risk program feeds quantified output into board reporting, insurance renewal, and regulatory disclosure workflows. Programs that execute all four consistently produce output leadership can act on. Programs that stop at the framework produce documentation no one uses.
The Four-Step Enterprise CRQ Playbook
The strongest CRQ programs execute a consistent four-step operating pattern regardless of which underlying methodology they draw on. Each step produces an output the next step depends on, and skipping any single step compromises the defensibility of the final numbers.
Step 1: Discover Assets and Map Business Impact
Effective CRQ starts with an accurate inventory of the systems, applications, and third-party dependencies the enterprise actually depends on, weighted by the business value each one supports rather than by IT replacement cost. A breach of a customer-facing portal produces materially different exposure than an isolated internal system, and the underlying model has to weight losses accordingly for the output to hold up under executive scrutiny.
Step 2: Model Threat Scenarios Probabilistically
Combine threats, assets, and controls into distinct, probabilistic scenarios rather than reporting individual vulnerabilities. Focus on the small number of scenarios that carry the highest financial exposure. Ransomware against core infrastructure. Third-party service provider failure. Data exfiltration from customer-facing systems. Each scenario should produce its own Average Annual Loss and tail loss figure so the board can see where the total exposure comes from and which scenarios move the number most.
Step 3: Run Monte Carlo Simulation With Sufficient Sample Size
Monte Carlo simulation runs thousands of trials against calibrated frequency and severity distributions to produce a full loss distribution rather than a point estimate. Sample size matters. Kovrr's engine runs 25,000 trials per quantification, which is what produces outputs that stay stable across reruns of the same scenario. Programs running hundreds or a few thousand trials produce numbers that move meaningfully between reruns, which is a signal to buyers that the underlying rigor is thin.
Step 4: Report Continuously, Not Annually
Cyber threats and control posture change faster than any annual quantification cycle can capture. Effective CRQ integrates with security tooling continuously, updating the quantification as controls, threats, and business processes change. This is what turns CRQ from a periodic exercise into a live operating metric that the board can trust, and it is where modern cyber risk modeling has moved the state of the art past its spreadsheet-era foundations.
The Core Mathematical Models Every CRQ Program Uses
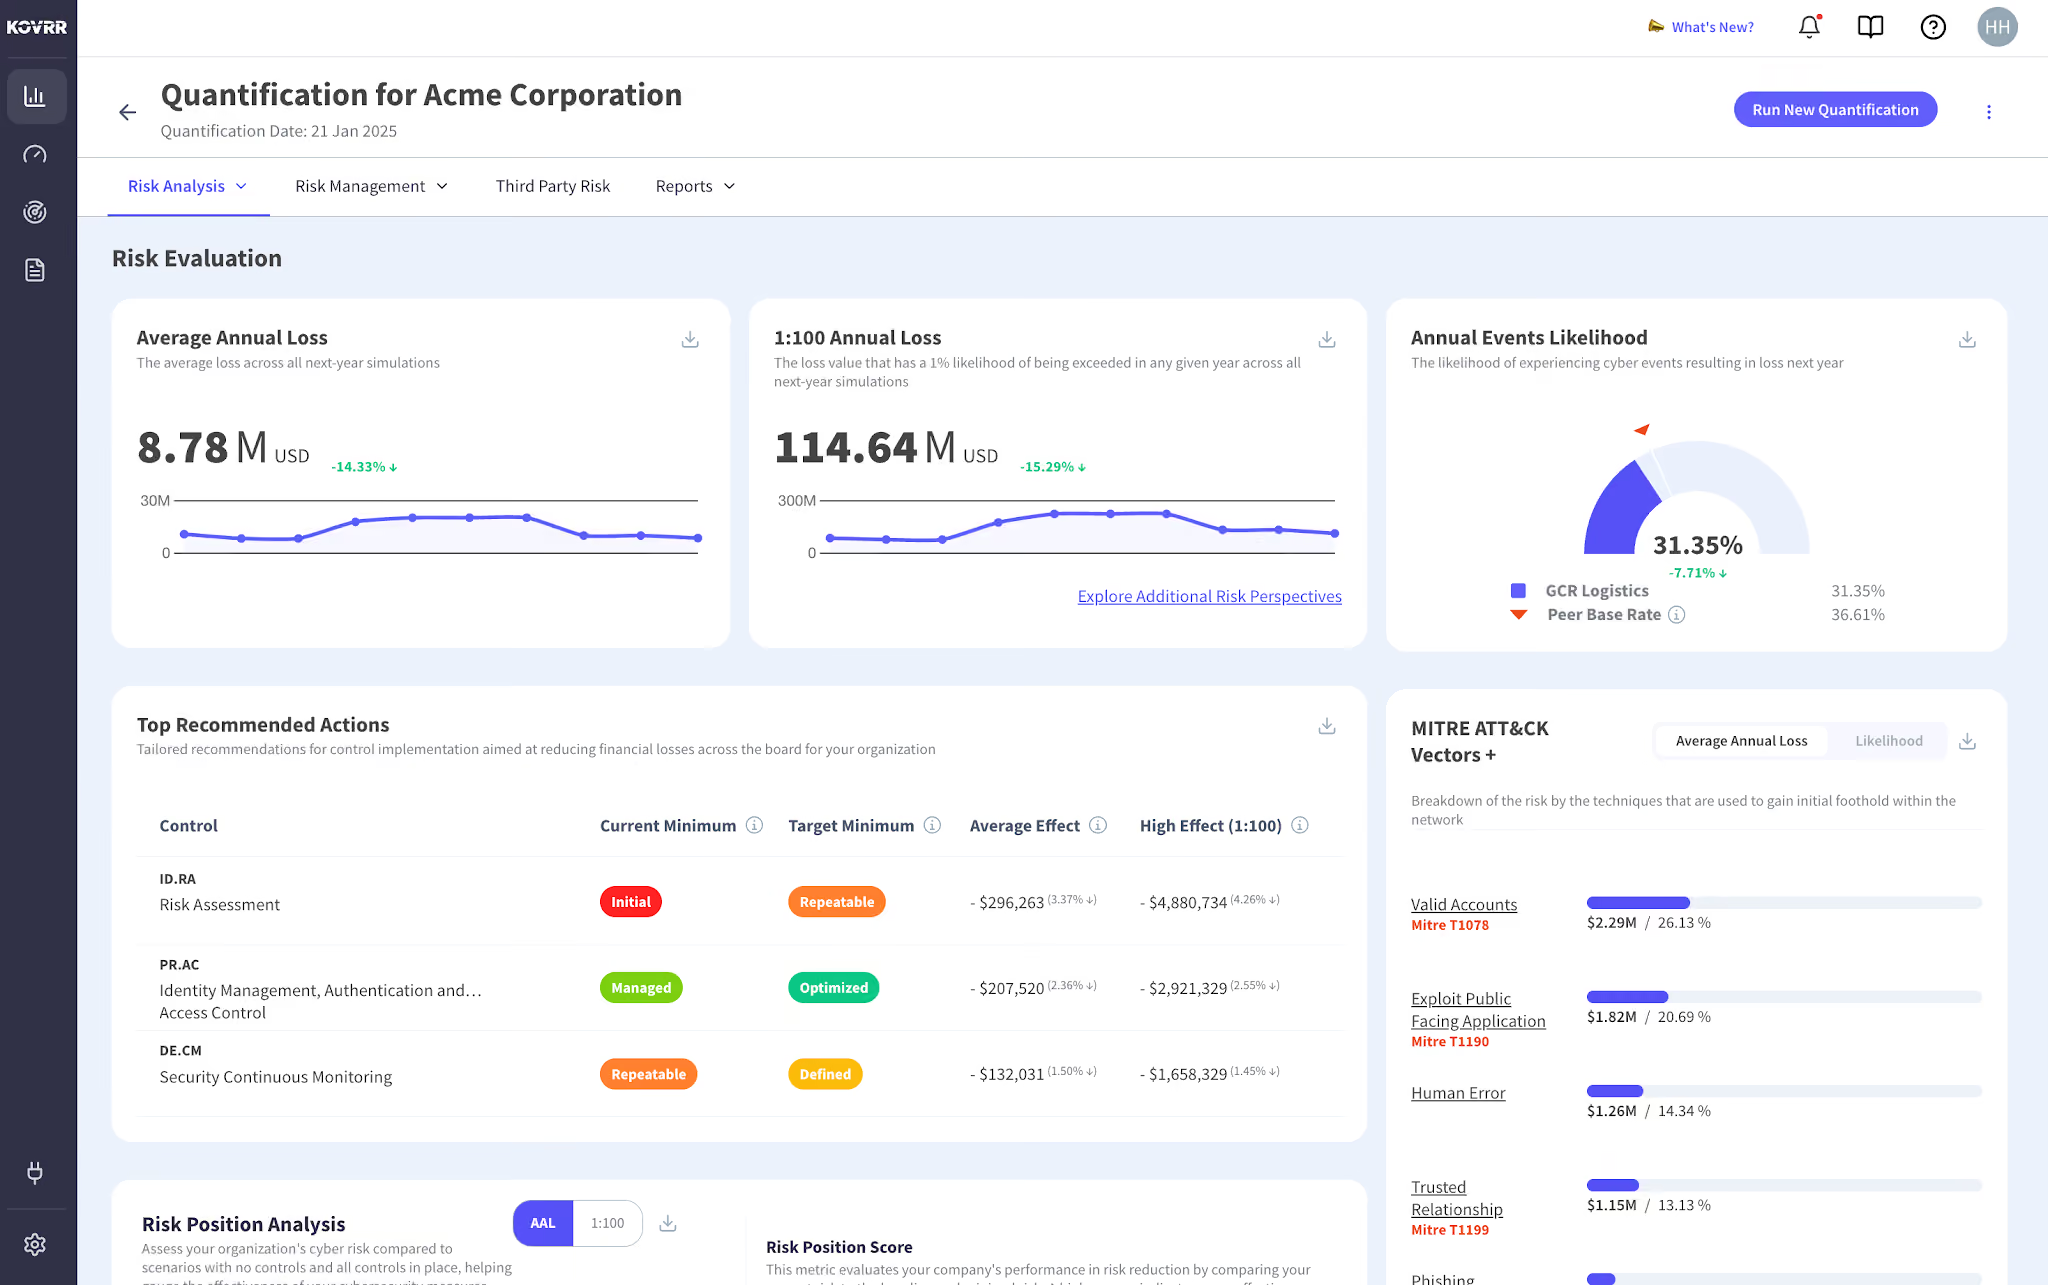
Every CRQ program, regardless of the specific framework it draws on, ultimately reduces to a small number of mathematical models applied at different points in the workflow.
Loss Expectancy Formulas
- Single Loss Expectancy (SLE): The financial loss from a single occurrence of a specific threat, calculated as Asset Value multiplied by Exposure Factor.
- Annualized Rate of Occurrence (ARO): The estimated frequency of a specific threat scenario occurring within a year, drawn from claims data, incident history, and industry benchmarks.
- Annualized Loss Expectancy (ALE): The expected annual financial exposure from a threat, calculated as SLE times ARO, aggregated across scenarios to produce enterprise-level exposure figures.
Probability Distribution Outputs
- Average Annual Loss (AAL): The expected-value midpoint of the loss distribution, representing the predictable baseline the organization carries.
- Tail loss at defined confidence intervals: The 1-in-100 or 1-in-200 loss figures that anchor stress testing, cyber insurance conversations, and materiality analysis for regulatory disclosure.
- Loss Exceedance Curve: The full probability distribution showing the annual likelihood of exceeding any dollar threshold, explained in depth in Kovrr's guide to the Loss Exceedance Curve.
How to Choose Between FAIR, NIST SP 800-30, and Actuarial Approaches
Multiple methodologies exist for cyber risk quantification, and the choice matters more than most buyers appreciate. Each has different strengths, different data requirements, and different fit for enterprise use cases.
FAIR
Factor Analysis of Information Risk breaks risk into two variables covering Loss Event Frequency and Loss Magnitude, further decomposed into contact frequency, probability of action, and various loss categories. FAIR provides a rigorous taxonomy for reasoning about risk. Programs that adopt FAIR often struggle with the data requirements needed to populate the model defensibly at enterprise scale, since the framework itself does not provide the underlying calibration data.
NIST SP 800-30
The NIST Risk Management Framework provides a structured approach to identifying, assessing, and prioritizing information security risks, extended in NIST SP 800-30 to cover risk assessment specifically. NIST is comprehensive and framework-agnostic, which makes it a strong fit for programs that need to align to federal standards or that operate across multiple regulatory environments simultaneously.
Actuarial-Grade CRQ
Actuarial approaches draw on insurance industry claims history and multi-source threat intelligence to calibrate the frequency and severity distributions the model depends on. This is the approach Kovrr's cyber risk quantification platform uses, extending decades of insurance industry loss modeling into cyber-specific scenarios.
Actuarial-grade calibration produces materially more defensible outputs than internally sourced estimates alone, which is why Yakir Golan has argued that data provenance is the primary determinant of CRQ model accuracy. For a comparison of how model choice affects output, the value of CRQ models versus CRQ frameworks covers the distinction that most buyer conversations underweight.
What Distinguishes Effective CRQ From Compliance CRQ
Programs that produce real strategic value differ from programs that produce compliance artifacts in specific, observable ways. Two categories separate the two.
Signs of Effective CRQ
- Continuous integration with security tooling: The quantification updates as vulnerability data, threat intelligence, and control maturity data flow in from live systems.
- Direct connection to business decisions: Board reporting, budget justification, insurance renewal, and regulatory materiality analysis all draw from the same underlying quantification.
- Traceable methodology: The vendor or internal team can defend every input, calibration choice, and modeling assumption when scrutinized by auditors or the board.
Signs of Compliance-Only CRQ
- Annual refresh cycles: Numbers get updated only during audit season and stay stale for the other eleven months of the year.
- Standalone dashboards: Output lives in an isolated report that never feeds the board deck, budget conversation, or insurance renewal workflow.
- Undefended assumptions: The team cannot explain where frequency or severity inputs came from beyond generic "industry benchmarks."
Common Traps in Cyber Risk Quantification Programs
Failed CRQ programs share a small number of recurring failure modes. Watching for these lets buyers avoid the pain other enterprises have already worked through.
Data and Modeling Traps
- Building on internally sourced data alone: Cyber incidents are low-frequency events for any single enterprise, so internal history is almost always insufficient to calibrate distributions defensibly.
- Running too few Monte Carlo trials: Models running hundreds or low thousands of trials produce output that shifts noticeably between reruns, which is a signal to be cautious.
- Relying on qualitative estimates for severity: Vague high-medium-low severity ratings undercut the credibility of every dollar figure that depends on them.
Program and Adoption Traps
- Treating CRQ as a compliance exercise: Programs built to satisfy auditors and never opened between audits accumulate stale entries and lose credibility.
- No connection to insurance renewal: Programs that produce quantified output but never use it in the cyber insurance coverage optimization conversation leave a significant portion of the discipline's value on the table.
- Skipping board translation: Even accurate CRQ output that stays in technical language keeps cyber trapped in the operational conversation rather than the strategic one covered in the board report product.
Making Cyber Risk Quantification an Enterprise Operating Discipline
Effective cyber risk quantification is not a report format or a framework selection. It is an operating discipline that translates technical cyber reality into the financial language every other category of enterprise risk already speaks.
Programs that execute the four-step playbook rigorously, draw on actuarial-grade data for calibration, run enough Monte Carlo trials to produce stable output, integrate continuously with security tooling, and connect quantified output directly to board reporting, budget decisions, insurance renewal, and regulatory disclosure produce the strategic leverage the discipline was built for. Programs that pick a framework, run the checklist, and never connect the output to enterprise decisions produce compliance artifacts and little else.
To see how Kovrr operationalizes CRQ across every step of this playbook, book a demo tuned to your industry and control posture.

How to Quantify CRQ FAQs
Speak to an ExpertHow can I quantify cyber risk effectively?

What is the difference between qualitative and quantitative cyber risk assessment?
Which cyber risk quantification methodology should I use?
How does effective CRQ connect to cyber insurance renewal?
What is the SLE and ALE calculation in cyber risk quantification?