
Blog Post
Summing Independent Scenarios Understates Your Tail
August 30, 2026
A quantification program with a dozen scenarios usually produces its annual figure by adding them together. Each scenario was modeled carefully, the arithmetic is simple, and the result is close to right for one of the two numbers the model produces.
Summing scenarios treats them as independent, and cyber scenarios share dependencies. The consequence is specific rather than general, and it is worth being precise about because it determines which decisions the resulting figure can support.
What Does Correlation Change, the Average or the Tail?
Almost entirely the tail. Expected annual loss is close to additive whether scenarios are independent or not, because an average is an average regardless of how events cluster. The extreme figure behaves completely differently, because it depends on multiple large losses landing in the same year, which is exactly what dependency makes more likely.
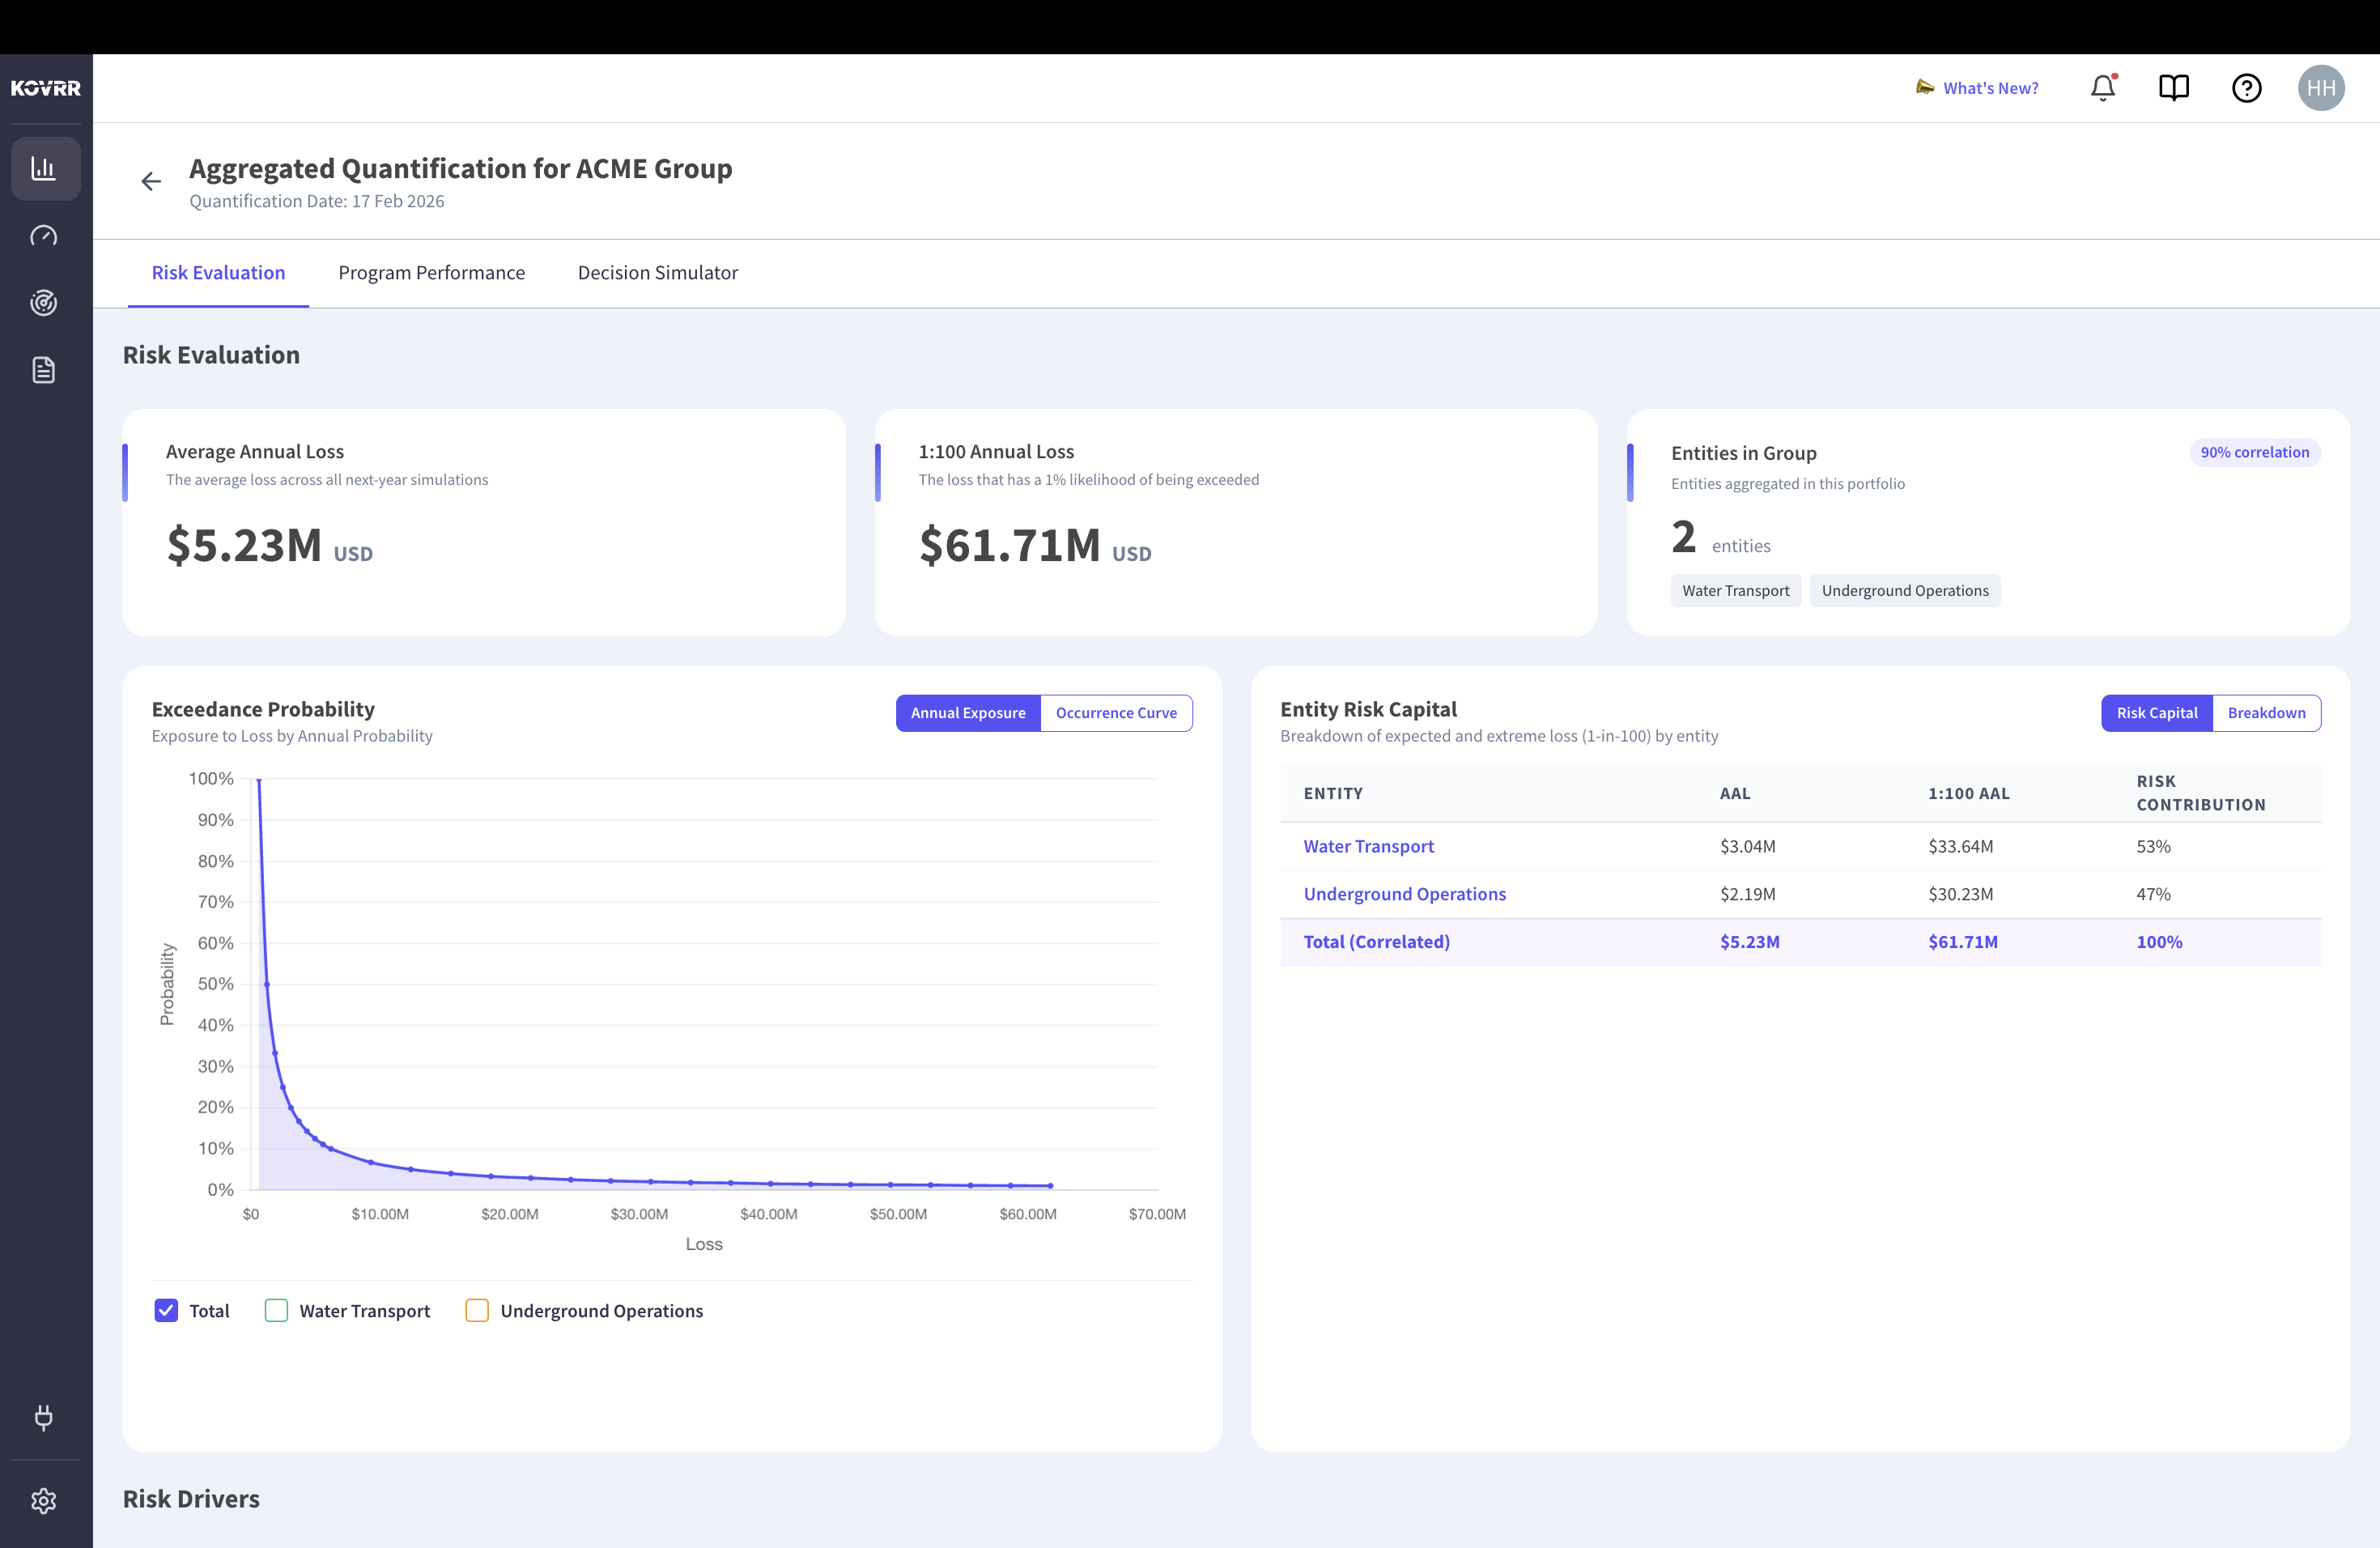
The practical implication follows directly. A program reporting expected annual loss is on reasonably solid ground with a summed figure. A program setting an insurance limit, an appetite threshold or a capital position from the same model is using the number that independence assumptions damage most, and decisions that depend on the tail are the ones to check first.
Why Are Cyber Scenarios Not Independent?
Three mechanisms, and all three are properties of how enterprise technology is built rather than artifacts of modeling choices.
Shared infrastructure is the first. A large share of scenarios route through the same cloud provider, the same identity provider or the same network layer, so a failure in the shared component appears simultaneously in several scenarios that were modeled separately. Supply chain structure is the second, where a compromise at one vendor reaches every downstream customer at once. Adversary behavior is the third and the one most often left out.
How Is Cyber Correlation Different From Natural Catastrophe?
It is chosen rather than bounded. Windstorm losses correlate because of geography and physics, which limits how much correlation is possible. Cyber correlation is produced deliberately, because an attacker who finds a shared component has an incentive to exploit it across every organization that depends on it. The dependency therefore becomes more dangerous as it becomes more widely used, which is the reverse of how diversification normally works.
How Much Does the Answer Move?
Bounding the effect is more useful than estimating the true correlation, and considerably easier. Run the aggregate twice, once with scenarios fully independent and once with them forced to co-occur, and compare the extreme figures.
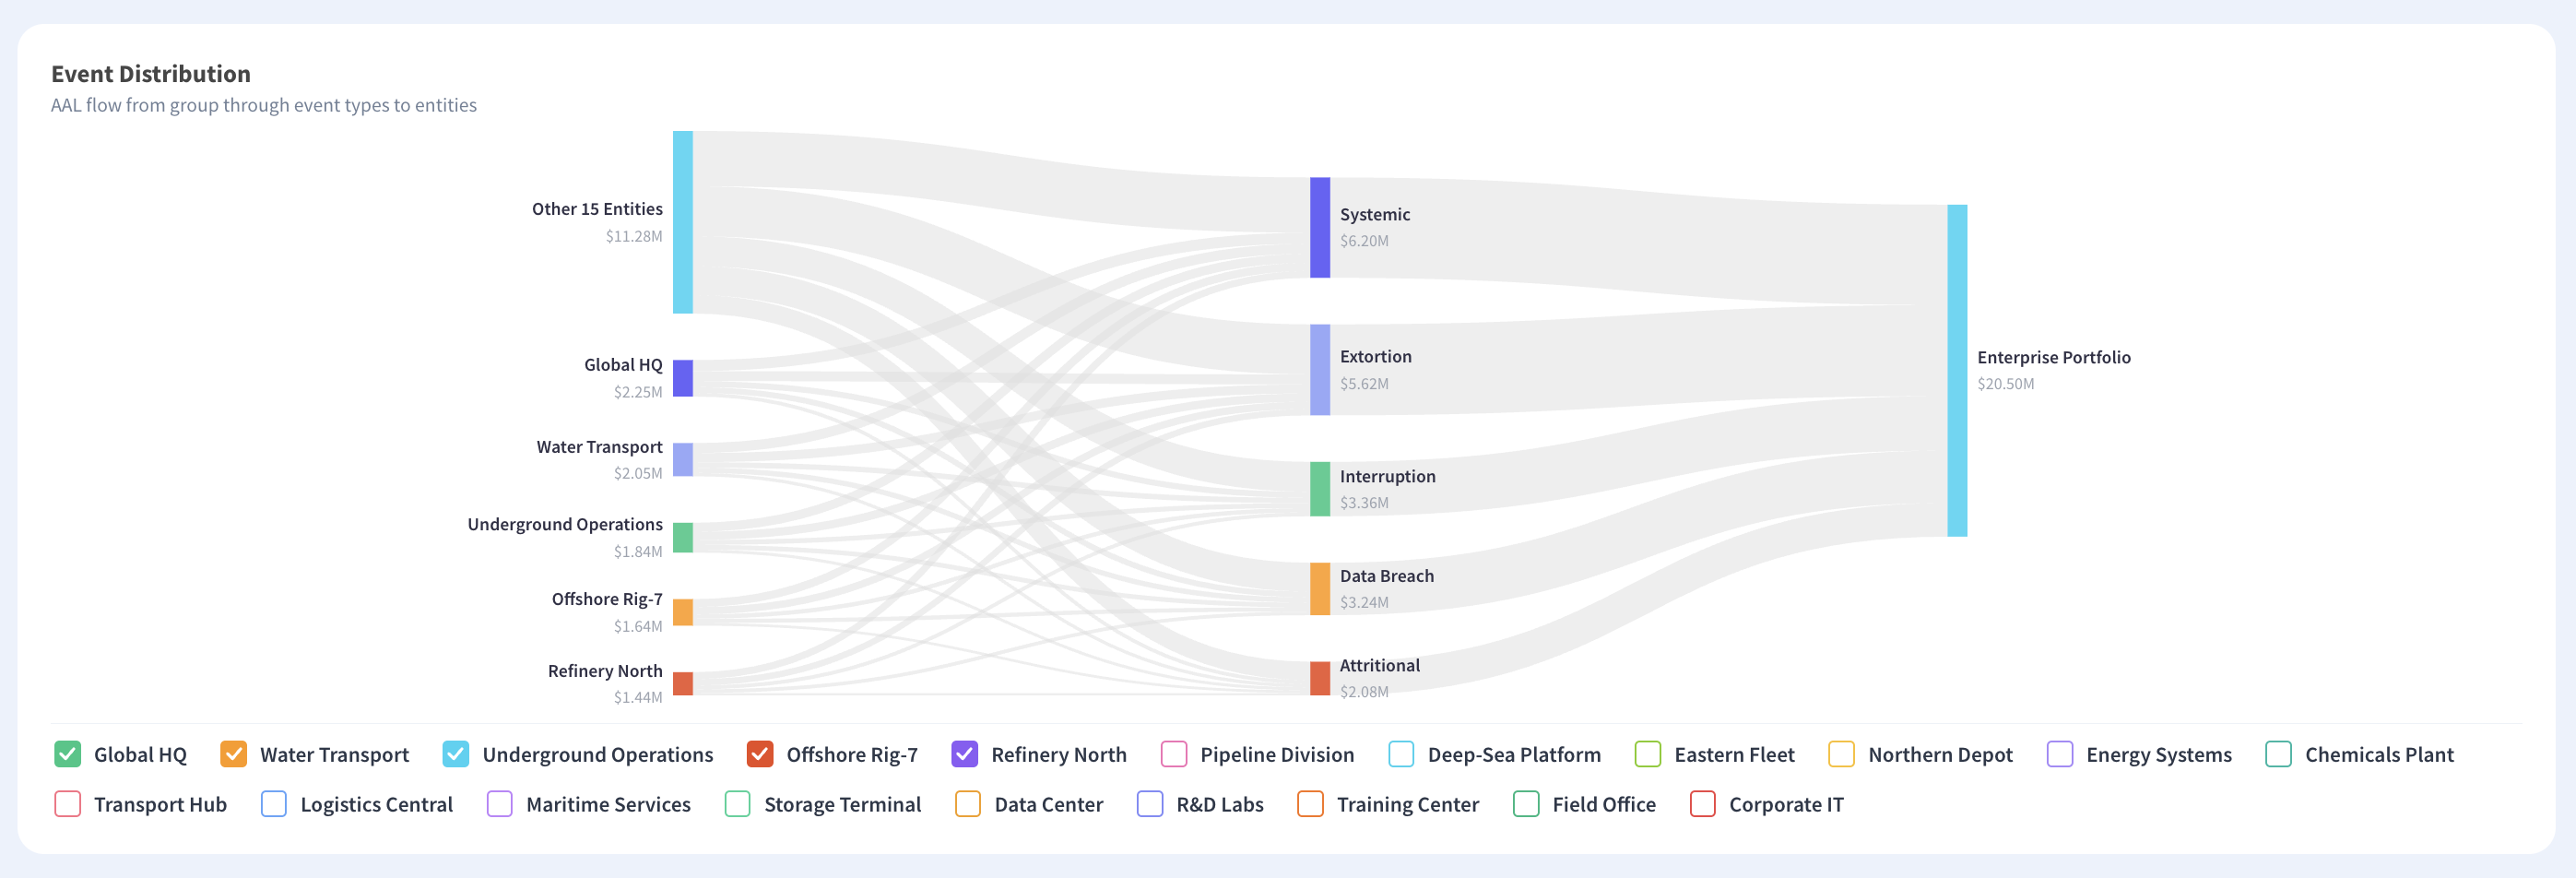
The distance between those two numbers is the range within which the truth sits, and its width tells you whether correlation is worth further work. Where the extreme figure roughly doubles, dependency is the dominant uncertainty in the model and deserves attention before anything else is refined. Where it moves a few percent, the scenarios genuinely are close to independent and the summed figure is fine.
Why Bound It Rather Than Estimate It?
Because you cannot estimate it from your own data. Correlation is inferred from co-occurrence, and a single organization experiences too few significant events to observe any. Fitting a dependency structure to a handful of incidents produces a coefficient with no evidential basis, whereas a range produced by bounding is honest about what is known, and statistical significance sets the limits on what a small sample can support.
What Does Correlation Do to a Group Figure?
The effect is easiest to see across legal entities, where the same mechanism operates at a scale somebody can inspect. A group aggregating exposure across subsidiaries faces the same question as a single organization aggregating scenarios, and the arithmetic behaves identically.
Two entities sharing most of their infrastructure sit at a high correlation and their combined extreme figure lands close to the sum of the individual extremes, because a severe year for one is likely to be a severe year for both. Twenty entities with genuinely varied technology sit lower, and their combined extreme figure falls well short of the sum, because the chance of all twenty having a bad year simultaneously is small. Both aggregates carry roughly the additive expected annual loss, which is the point.
Which Direction Should You Expect to Be Wrong In?
Understated, almost always. An organization that has not examined dependency has implicitly assumed independence, which is the assumption producing the smallest tail. Programs discovering the issue generally find their extreme figure rises rather than falls, and the size of the rise is what the bounding exercise establishes before anyone commits to a number.
Does This Apply Within a Single Entity?
Equally, and less visibly. A single organization modeling ransomware, a cloud outage and an insider event as separate scenarios has three entries that may all depend on the same identity provider. Nothing in the register indicates that, because each scenario was written from the perspective of its own threat rather than its shared prerequisites, and how a scenario library is designed determines whether the overlap is ever noticed.
Where Do the Shared Dependencies Hide?
Finding them is an inventory exercise rather than a modeling one, which is the good news, and four places account for most of what gets missed.
- Identity: A single sign-on provider or directory service that most scenarios implicitly assume is available.
- Infrastructure Region: Systems modeled separately that run in the same cloud region or availability zone.
- Fourth Parties: Two vendors assessed independently that both depend on the same subprocessor.
Recovery capability completes the list and is the least obvious. Scenarios frequently assume the same incident response team, the same backup infrastructure and the same forensic retainer, so two concurrent events do not get two responses. The assumption is invisible in each scenario individually and wrong across the pair, and assessing third parties across a portfolio is where the fourth-party layer starts becoming visible.
Which of These Can Be Found Without New Tooling?
The first two, immediately. Listing which identity provider and which region each scenario depends on takes an afternoon and produces the overlap directly. Fourth parties require asking vendors, which is slower and frequently answered incompletely. Recovery capacity requires only asking the response team whether they could run two incidents at once, and the answer is usually no.
What Does This Change in Practice?
Three changes follow, and none requires a more sophisticated model or a different vendor.
State the correlation assumption next to every aggregate figure, since a one-in-hundred number presented without it is uninterpretable. Report the independent and dependent bounds rather than a single aggregate, which is more honest and frequently more persuasive. Treat a shared dependency discovered in the inventory as a register entry in its own right, because the dependency is the exposure rather than a parameter of other exposures. Concentration that cannot be diversified away is the situation those entries describe.
How Should the Range Be Presented?
As two figures with the assumption named, rather than as a single number with a confidence qualifier. Saying the extreme annual loss falls between one figure under independence and another under full dependency, with the working assumption stated, gives a board something it can interrogate. A single figure invites the question of how confident anyone is, which has no good answer, whereas a range invites the question of which end is more likely, which is a discussion worth having.
What Does This Mean for Insurance Structure?
Correlated exposure argues for attention to the aggregate rather than the per-event limit, because two events in one policy year draw on the same annual aggregate and a program sized on a single severe event may exhaust before the second is settled. Reinstatement provisions matter more in a correlated portfolio than in an independent one, and they are the sort of term that gets accepted without examination at renewal.
What Should You Not Claim?
Three limits belong in any presentation of correlated aggregate figures, because the method invites more confidence than it supports.
The correlation figure is an assumption rather than a measurement, whatever precision it is stated to. The dependency inventory is incomplete by construction, since fourth and fifth parties are not fully knowable from inside the organization. Correlation is also not stable, because a migration, an acquisition or a vendor consolidation changes it without anyone updating the model. A figure carrying an assumption from eighteen months ago describes an architecture that has moved.
What Should You Do This Quarter?
Four steps, in order, and the first two require no modeling work at all.
List the identity provider, cloud region and critical vendor each scenario depends on, then look for names appearing repeatedly. Ask the incident response function whether it could run two significant events concurrently, and record the answer. Re-run the aggregate under both independence and full dependency to establish the range. Then decide whether the width of that range changes any decision currently made from the single figure, since where it does not, the exercise is complete and where it does, you have found the most consequential uncertainty in the model.
Who Should Own the Dependency Inventory?
Whoever owns the scenario library, since the overlap is a property of the library rather than of any individual entry. Assigning it to a vendor management function tends to produce a list of suppliers without the mapping to scenarios that makes it useful, and a register built for decisions is where the mapping belongs.
How Often Does This Need Revisiting?
On architectural change rather than on a schedule. A cloud migration, an acquisition, a vendor consolidation or a move to a shared identity platform each alter the dependency structure materially, and each happens without anyone considering the risk model. A calendar review will catch it eventually and a trigger tied to those events catches it when it matters.
Report the Assumption, Not Just the Number
Adding scenarios together produces a defensible expected annual loss and an extreme figure that understates reality by an amount nobody has bounded. The dependencies causing it are structural, created by shared infrastructure, supply chain layering and adversaries who deliberately target what many organizations rely on. Running the aggregate with and without independence gives a range, and the width of that range says whether the question deserves further work. The shared dependencies themselves are found by inventory rather than by mathematics. Kovrr's cyber risk quantification reports aggregate exposure with the correlation applied and stated, so the assumption travels with the figure.
To see aggregate exposure with the correlation assumption visible rather than implied, book a demo with our cyber risk experts.

Correlated Loss FAQs
Speak to an ExpertDoes correlation change the average or the tail?

Why are cyber scenarios not independent?
How is cyber correlation different from natural catastrophe correlation?
How do you handle correlation without estimating a coefficient?
Where do shared dependencies hide?
What should not be claimed about a correlated aggregate?