
Blog Post
Calibrating a Cyber Loss Model to One Environment
October 8, 2026
A model built on industry data produces an industry answer. The obvious next step is to calibrate it to the specific environment, and the obvious place to start is the threat picture, because every organization believes its own is distinctive.
It is the wrong parameter to start with. Some inputs should stay general, some must be local, and the ones that must be local are the harder ones to observe, which is why they get left at a default.
Which Test Sorts the Parameters?
Whether your own decisions move it, which resolves the whole taxonomy from one principle.
A parameter you can change by acting is local by definition. A parameter that stays the same whatever you do is exogenous. Deploying a control does not reduce how often adversaries attempt intrusions against your sector, and it does change how many of those attempts succeed.
Which Puts Frequency and Effectiveness on Opposite Sides
Threat frequency is largely outside your influence, so industry observation is the better source. Control effectiveness is entirely within it, so industry benchmarks describe somebody else. The two parameters need opposite calibration strategies and most programs apply the same one to both.
Why Does Local Frequency Data Disappoint?
Two reasons, and they are different failures rather than one.

An organization's own incident history is a very small sample of a rare-event process, so it carries almost no signal about annual likelihood. Perimeter telemetry also measures attempts rather than the events the model prices, so the abundant local data is measuring a different quantity from the one needed.
What Should Local Data Do to Frequency?
Adjust rather than replace. An industry baseline moved up or down for public profile, sector and observed reconnaissance intensity is defensible, and a frequency derived purely from internal history is not, which working without an incident history addresses where the internal record is thinnest.
What Does a Benchmark Assume About a Control?
It assumes the control works, and correcting that is what local data is for.
Vendor and framework benchmarks describe a control operating as designed across the population it is meant to cover. Real deployments are partial, misconfigured in places and stale in others. So an uncalibrated model inherits an effectiveness figure that assumes conditions nobody has.
Which Gives This Correction a Known Direction
Calibrating control effectiveness locally almost always moves the exposure figure up, because reality is a discount on the benchmark rather than a premium. Frequency calibration moves the figure either way. So a program that calibrates only frequency has a number that could be wrong in either direction, and one that calibrates effectiveness has corrected a bias with a known sign.
What Makes Effectiveness Measurable?
Coverage, expressed as a proportion of a stated population rather than as a presence.
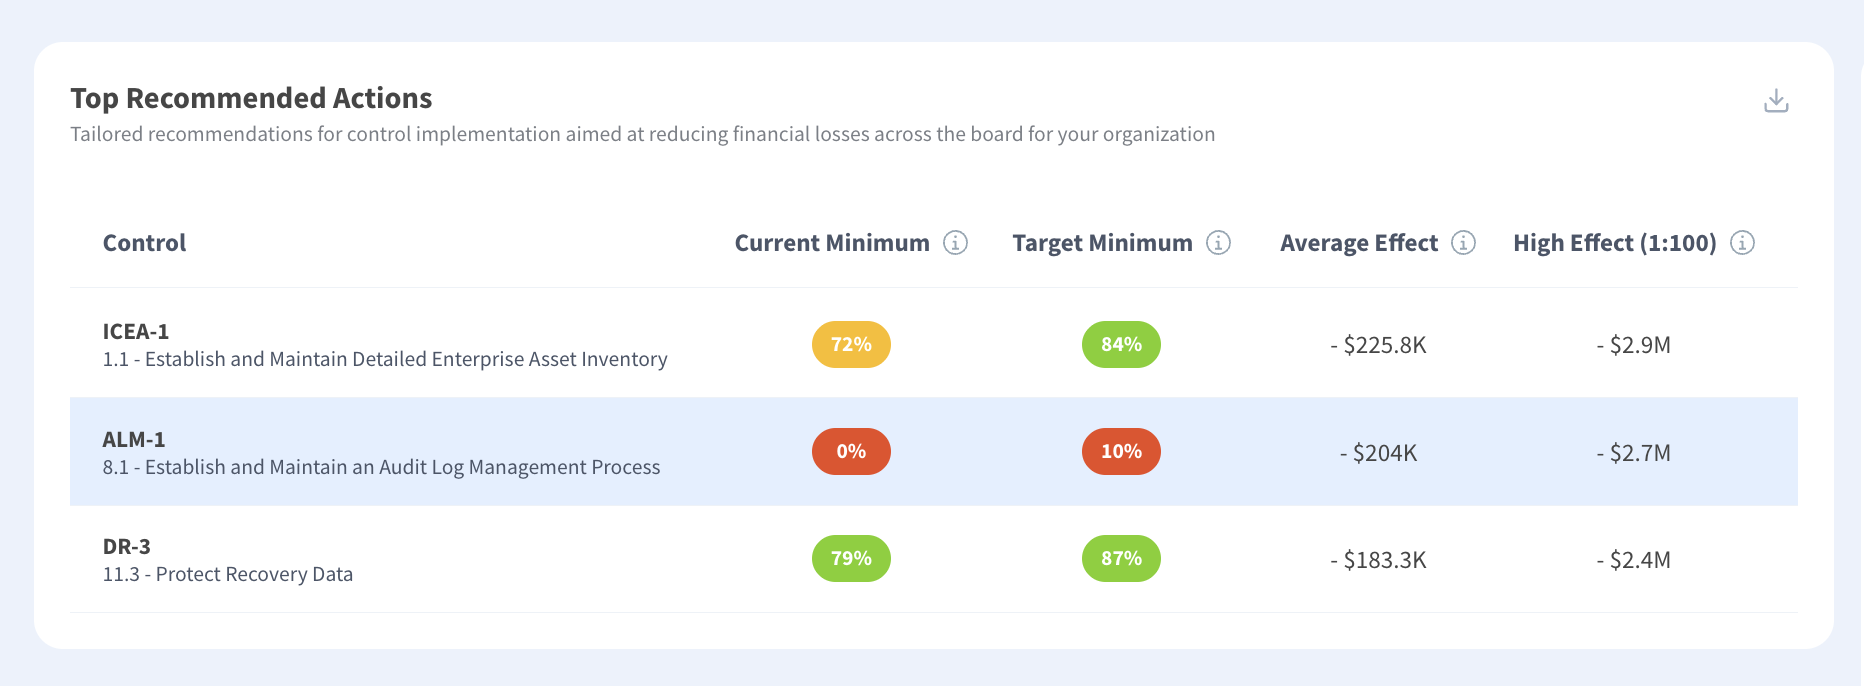
Whether a capability is deployed is a yes or no. On what proportion of which assets, verified how recently, is a number. The second is what a model can use and the first is what most control registers hold.
Which Makes It an Inventory Question First
A coverage percentage needs a denominator, so the population has to be enumerated before the proportion means anything. An organization that cannot state how many assets exist cannot state coverage, and attributing a loss reduction to a control depends on the figure being a proportion rather than a status.
What Is the Third Tier?
Structure, where general data has almost no content and the tail gets decided.
Asset distribution, privilege concentration and system interdependency are purely local. No industry figure describes how many of your systems a compromise of one identity reaches. The reach is what determines the severe end of the distribution rather than the typical case.
A Generic Structure Produces a Generic Tail
A model left generic on structure produces a tail describing an average organization's blast radius. Since the tail is the figure capital and limit decisions rest on, leaving the structural tier at default calibrates the part nobody uses and defaults the part everybody does, and how much precision a model can support ranks them accordingly.
Can Calibration Go Too Far?
Readily, and the failure looks like rigor rather than error.
A model relying solely on local data is paralyzed by thin records, producing wide intervals and unstable figures that move with each new observation. Over-localizing a rare-event parameter substitutes noise for a defensible prior, and the resulting number is more specific and less reliable.
What Is the Right Question Per Parameter?
Which source is less bad rather than whether local is better. Where the local sample is thin and the industry sample is large, general wins. Where the industry figure describes conditions you do not have, local wins. Stating that choice per parameter is what makes a calibration auditable, and auditing a model somebody else built starts by asking which was chosen where.
How Often Should Each Tier Be Refreshed?
On three different cycles, because the parameters change at three different speeds.
Threat frequency changes when the landscape does, which is annual at most and is somebody else's publication schedule rather than yours. Control coverage changes continuously, since a rollout progresses and a device population turns over. Structure changes on events, meaning an acquisition, a migration or a reorganization.
Which Explains a Common Waste
An annual recalibration exercise refreshes all three together, which is too often for the first tier and nowhere near often enough for the second. Coverage measured once a year is a year stale for most of that year, and the figure it feeds is stale with it, which verifying continuously rather than annually addresses directly.
What Is the Practical Arrangement?
Coverage from a live source, frequency from a published baseline reviewed annually, structure refreshed on trigger events. Three cadences rather than one calendar entry, and only the first requires anything to be built.
What Should Be Established?
Three things, and the middle one is the work.
Which parameters your own decisions can move, since those are the local ones and the list is shorter than expected. Current coverage as a proportion for each control that appears in the model, because that is the input a benchmark cannot supply and the one that corrects a known bias. Then whether the structural tier is populated locally at all, since a generic structure produces a generic tail. Cyber risk quantification that accepts measured control effectiveness rather than a status flag is what makes the second possible.
Calibrate What Your Decisions Move
A parameter your own actions can change is local and one that stays the same whatever you do is exogenous, which puts threat frequency and control effectiveness on opposite sides. Local frequency data disappoints twice, since an internal incident history is too small a sample of a rare-event process and perimeter telemetry measures attempts rather than priced events, so the right treatment is an industry baseline adjusted rather than replaced. Control effectiveness is the opposite, because benchmarks assume a control operating as designed across its intended population while real deployments are partial, so calibrating locally has a known direction and moves the figure up. The input that makes it possible is coverage as a proportion rather than a presence, which needs an enumerated denominator. Kovrr's cyber risk quantification takes measured coverage rather than a status flag.
To see exposure recalculated from measured control coverage rather than benchmark assumptions, book a demo with our risk experts.

Model Calibration FAQs
Speak to an ExpertWhich cyber loss model parameters should be calibrated locally?

Why is local threat frequency data unreliable?
Why does calibrating control effectiveness move the figure up?
What makes control effectiveness measurable in a loss model?
Which model parameters have no useful industry equivalent?
Can a loss model be calibrated too locally?