
Blog Post
Measuring AI Agent Coverage Against the Gateway Log
September 23, 2026
A tool gateway reads every call that crosses it and enforces policy on each one. It is blind to whatever never traverses it, which is established and not the interesting part.
The useful number is what fraction of an agent's total action surface the gateway covers. Blindness of unknown size and blindness of known size are different problems, and only the second lets you state what a gateway-based claim is worth.
What Is the Coverage Figure?
Calls the gateway observed, divided by calls the agent made, for the same session. Both halves are obtainable and only one of them comes from the gateway.
The numerator is straightforward, since a gateway logs what passed through it. The denominator is the problem, and getting it from the wrong place produces a figure that is always close to one and always meaningless.
Why Can't the Gateway Supply the Denominator?
Because it can only count what reached it. Asking a gateway how many calls it missed is asking it about events it has no record of, and the answer will be none. The same error appears wherever a control's own console is used to define its population, since an endpoint product reports how many machines run its agent and cannot report the machines that do not.
Where Does the Denominator Come From?
The agent's own record of what it invoked, which is available and imperfect in a specific direction.
Most agent frameworks expose a session trace listing the tools called, in order, with arguments. Comparing that list against the gateway log for the same session and the same agent gives the two counts the ratio needs, and the exercise takes minutes rather than a project.
Which Direction Does the Error Run?
Toward flattery, which is worth knowing before the figure is quoted. The trace is written by the party being measured, so where it under-reports, the denominator shrinks and coverage appears higher than it is. A coverage figure derived this way is therefore an upper bound rather than an estimate, and a source written by the observed party needs corroborating rather than trusting.
What Corroborates the Denominator?
Host-level observation, which is independent of both the gateway and the agent and therefore bounds the figure from the other side.
A local tool server spawning as a child process leaves a process event. A network connection to a remote tool endpoint leaves a connection record. Neither reveals what was called or what came back, and both establish that an invocation occurred, which is all a denominator needs. Where the host count exceeds the agent's own trace, the trace is incomplete and the coverage figure was overstated.
Which Gives You Three Numbers Rather Than One
Gateway observations, agent-reported invocations and host-observed invocations. Coverage against the second is the optimistic reading and coverage against the third is the defensible one, and the distance between the two measures how much the agent's self-report can be relied on.
What Does a Coverage Figure Below One Change?
Every claim the gateway supports, which is the point of measuring it.
A statement that no unauthorized tool calls occurred becomes a statement that none occurred among the observed portion. The qualified version is weaker and checkable, where the unqualified one rests on an assumption the gateway cannot support. An auditor asking how the absence was established gets a proportion rather than an assertion.
Which Is What a Control Assessment Needs
A control scored as implemented with no coverage figure is being credited at full effectiveness by default. Recording the proportion alongside the score changes what flows into any later exposure calculation, and pricing what a control does and does not cover depends on that proportion existing.
Should Coverage Be Reported as One Number?
No, and this is the part that turns a metric into something actionable. Coverage is bimodal rather than continuous.
A session using only remote tools is close to fully covered, since every call crosses the gateway by construction. A session using local tools is close to zero, since none of them does. An agent doing both produces an average that describes neither, and moving that average by ten points tells you the session mix changed rather than that coverage improved.
What Should Be Reported Instead?
Coverage per session type, with the proportion of sessions in each. Two figures and a mix, which between them say what is observed, what is not, and how much of the activity falls into each. Three numbers a reader can act on, rather than one that moves for reasons nobody can attribute.
What Should Be Done With the Uncovered Portion?
Constrained rather than observed, since the reason it is uncovered is architectural rather than a deployment shortfall.
Local tool invocation cannot be routed through a network control without changing how the agent works. So the available lever is which tools exist in the local set at all, since a tool that is not registered cannot be invoked and needs no observation. Reducing the local tool set is the control that operates on the uncovered fraction, and it is a configuration decision rather than a monitoring one.
Which Reframes the Gateway Decision
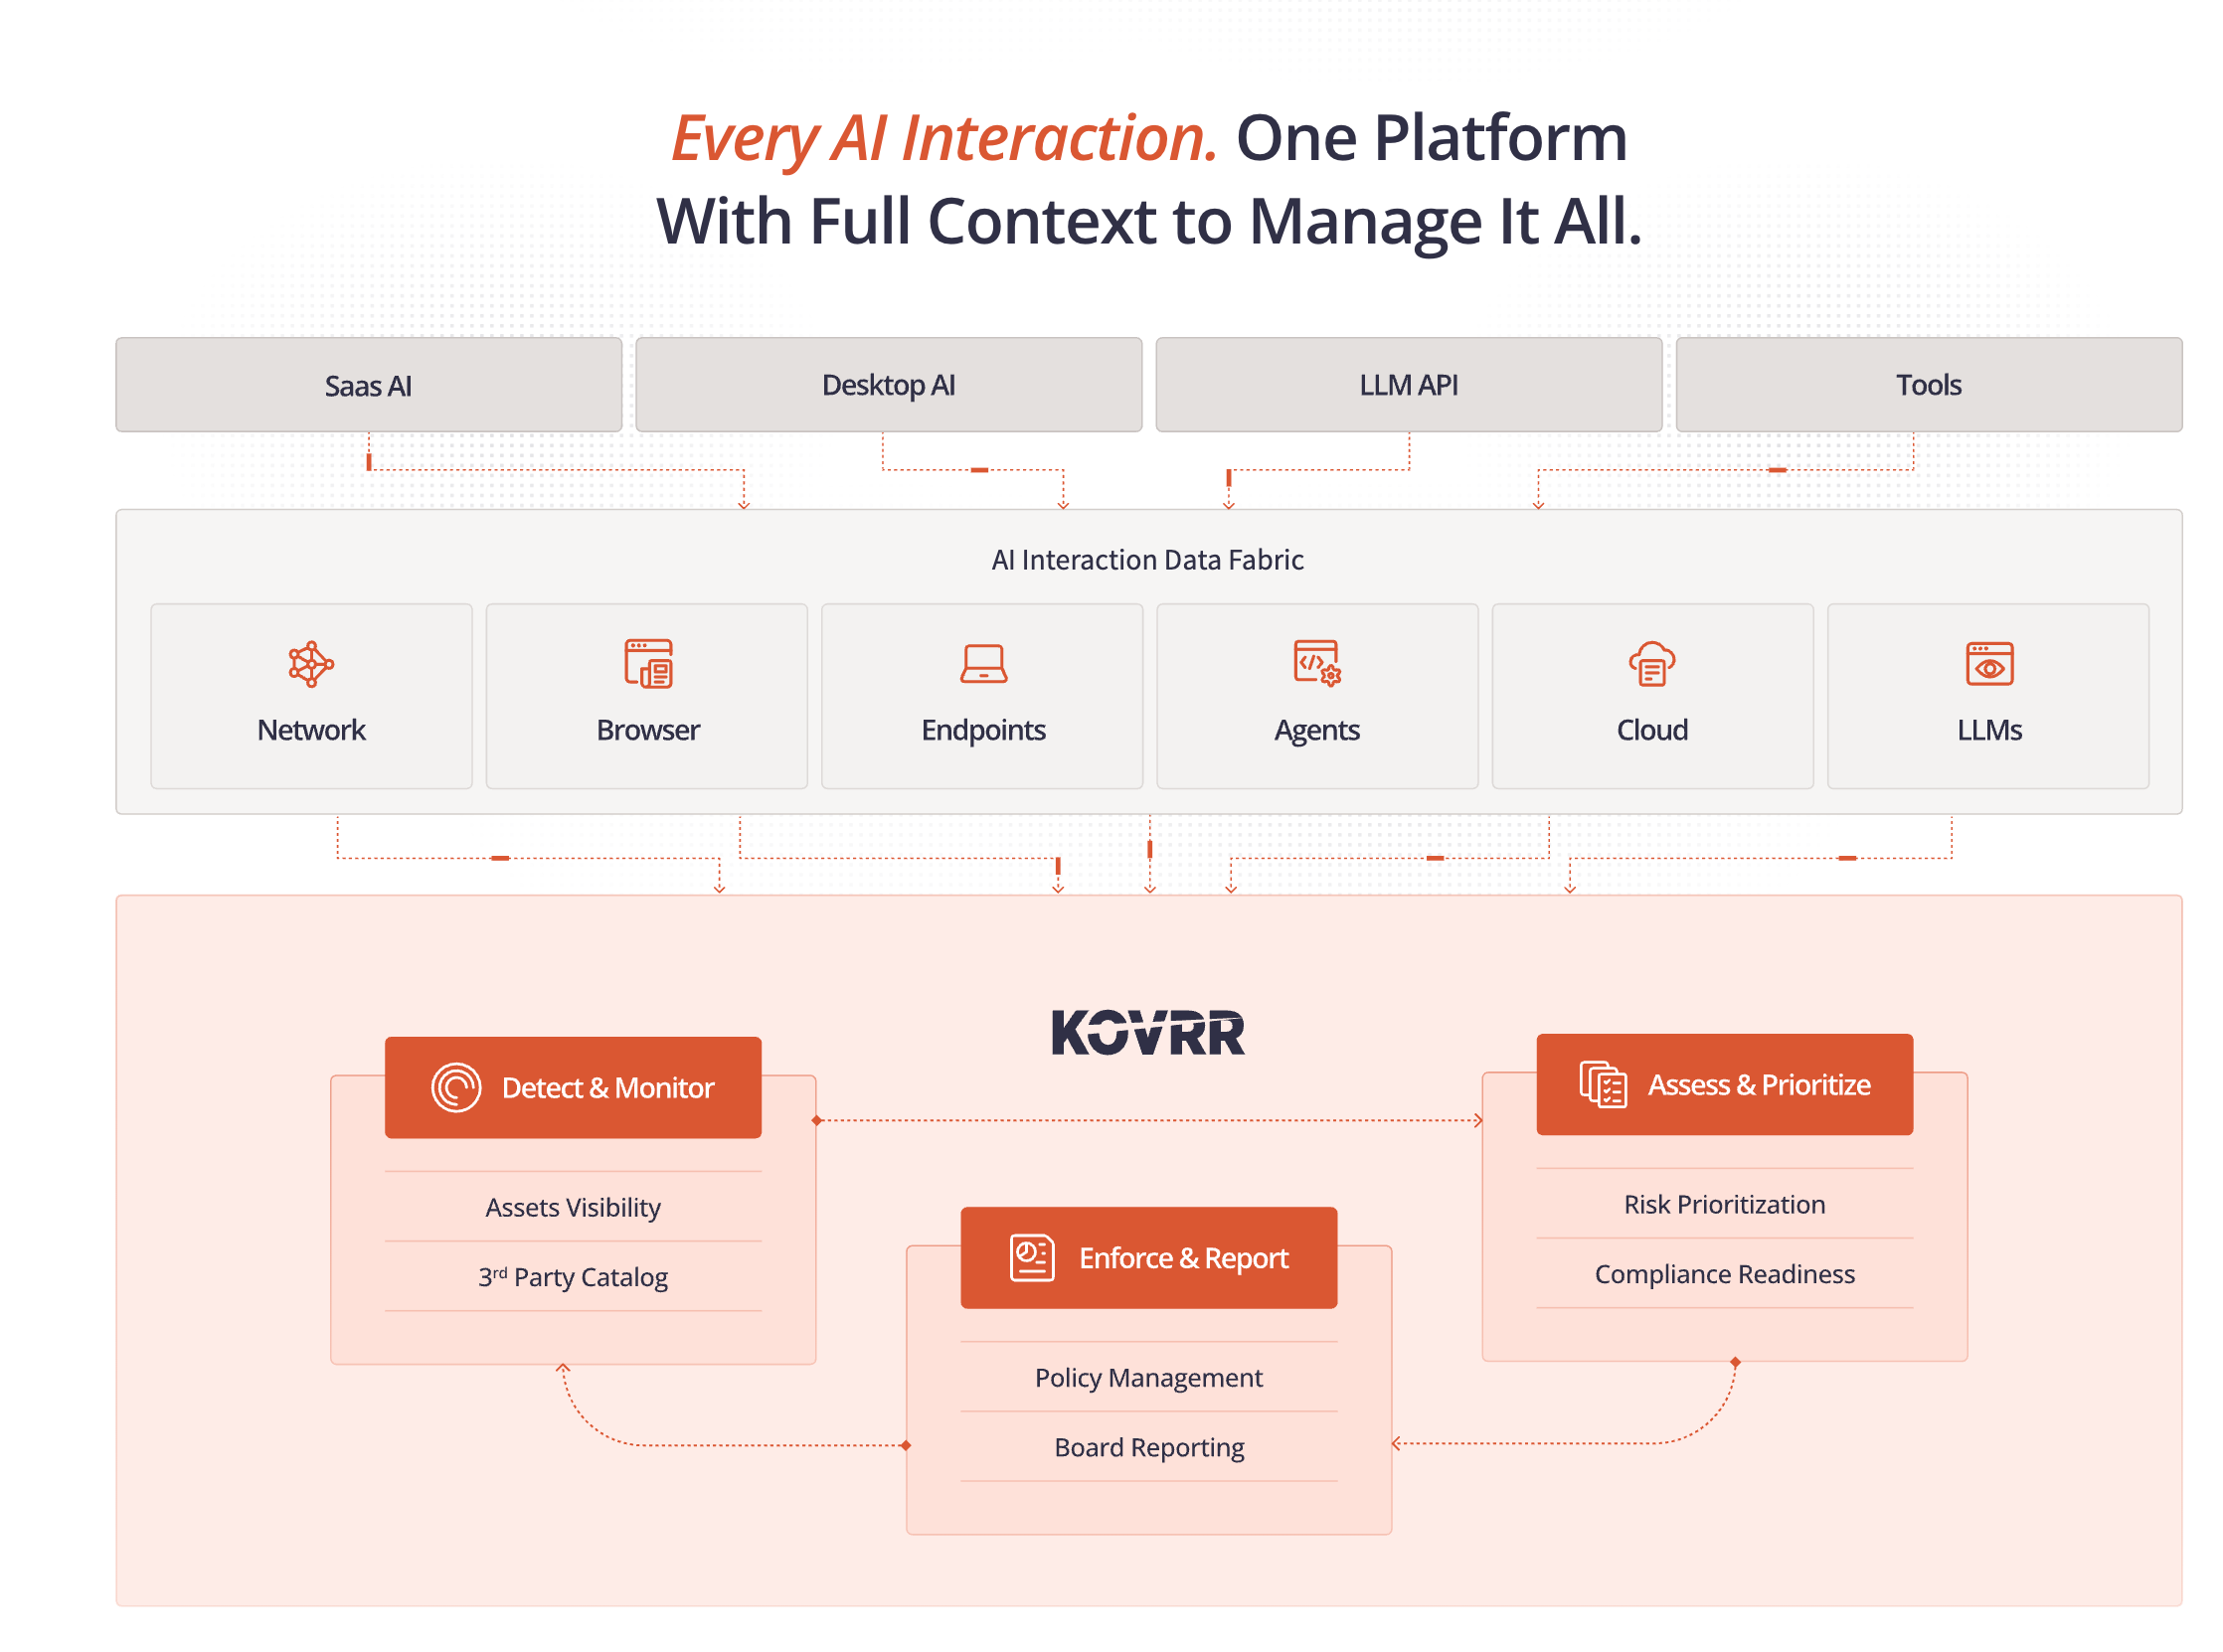
A gateway is worth deploying and it is not a coverage strategy on its own. The pairing is a gateway for the remote fraction and a constrained tool set for the local one, with the measured split telling you which side deserves the effort. An AI Interaction Data Fabric supplies the host-level count that makes the split measurable.
Does the Same Method Work on Other Controls?
On most of them, and the pattern is worth extracting because the gateway case is one instance of a general error.
Any control reporting its own coverage is reporting on the population it can see. A browser extension reports the sessions it observed and not the ones on unmanaged devices. A proxy reports traffic that traversed it and not traffic that bypassed corporate egress. A data platform audit reports queries it logged and not access through a route it does not sit on. In each case the honest denominator comes from somewhere the control does not reach.
Which Sources Can Serve as Denominators?
Whichever is authoritative for existence rather than for behavior. Directory records establish how many identities exist, procurement and device management establish how many endpoints exist, and network flow records establish that a connection happened without saying what crossed it. None of those describes what occurred and all of them bound how much occurred, which establishing what each source is authoritative for sets out.
What Is the Reporting Rule?
Never report a control's effectiveness without the coverage figure beside it, and never take the coverage figure from the control. Two sentences that would change most control registers, and neither requires new tooling to apply.
What Can Be Measured This Week?
One agent, one day, three counts.
Pull the agent's session traces for a representative day and count tool invocations. Pull the gateway log for the same agent and window and count observations. Pull process and connection events from the host for the same window and count invocations independently. The first ratio is the optimistic coverage figure, the second is the defensible one, and the difference between the two denominators tells you how much the agent's self-report is worth. An AI data fabric makes the third count available across the population rather than one agent at a time.
Measure the Denominator Somewhere Else
A gateway covers what crosses it and cannot report what did not, so asking the gateway to define its own population produces a figure near one with no information in it. The denominator comes from the agent's own session trace, which is written by the party being measured and therefore errs toward flattery, and it gets bounded by host-level process and connection events that are independent of both. Three counts produce an optimistic coverage figure, a defensible one, and a measure of how much the self-report can be trusted. Coverage is bimodal rather than continuous, so a single average moves when the session mix changes and says nothing about the control. The uncovered fraction is addressed by shrinking the local tool set rather than by monitoring it. Kovrr's AI Security and Governance Platform supplies the independent count a coverage figure has to rest on.
To see what proportion of your agents' tool activity a gateway observes, book a demo mapped to your own estate.

Gateway Coverage FAQs
Speak to an ExpertWhat is the gateway coverage figure?

Where should the denominator come from?
What corroborates the denominator?
What does a coverage figure below one change?
Should coverage be reported as a single number?
What should be done with the uncovered portion?