
Blog Post
What an Open Control Weakness Costs You Every Month
August 16, 2026
Security programs price control work as an investment decision. What does the fix cost, what does it remove, does the return justify the spend. The framing answers whether to do something and says nothing about the cost of the interval before it gets done.
An unimplemented control accrues expected loss for every month it stays unimplemented. Treating that accrual as a figure rather than a severity label changes the remediation queue, gives accepted risk a price, and puts a number on what a compensating control buys while the primary one remains broken.
The Exposure Window Already Has a Name
Vulnerability management calls the interval between identification and remediation the window of exposure, and remediation service levels exist to bound it. What the field measures in days, this argument measures in currency, which is the only addition.
One caveat carries over from the underlying method. Annualized loss exposure is probabilistic rather than predictive, and practitioners deliberately avoid the word expectancy because readers hear it as a forecast. A monthly accrual figure is a rate derived from a distribution, not an invoice, and presenting it as the latter invites a challenge it cannot survive.
Severity Ranks Weaknesses, Accrual Prices Them
A severity rating answers how bad an exploitation would be. It does not answer what the organization is paying to leave the weakness open, and those produce different queues.
The Arithmetic Is Simple
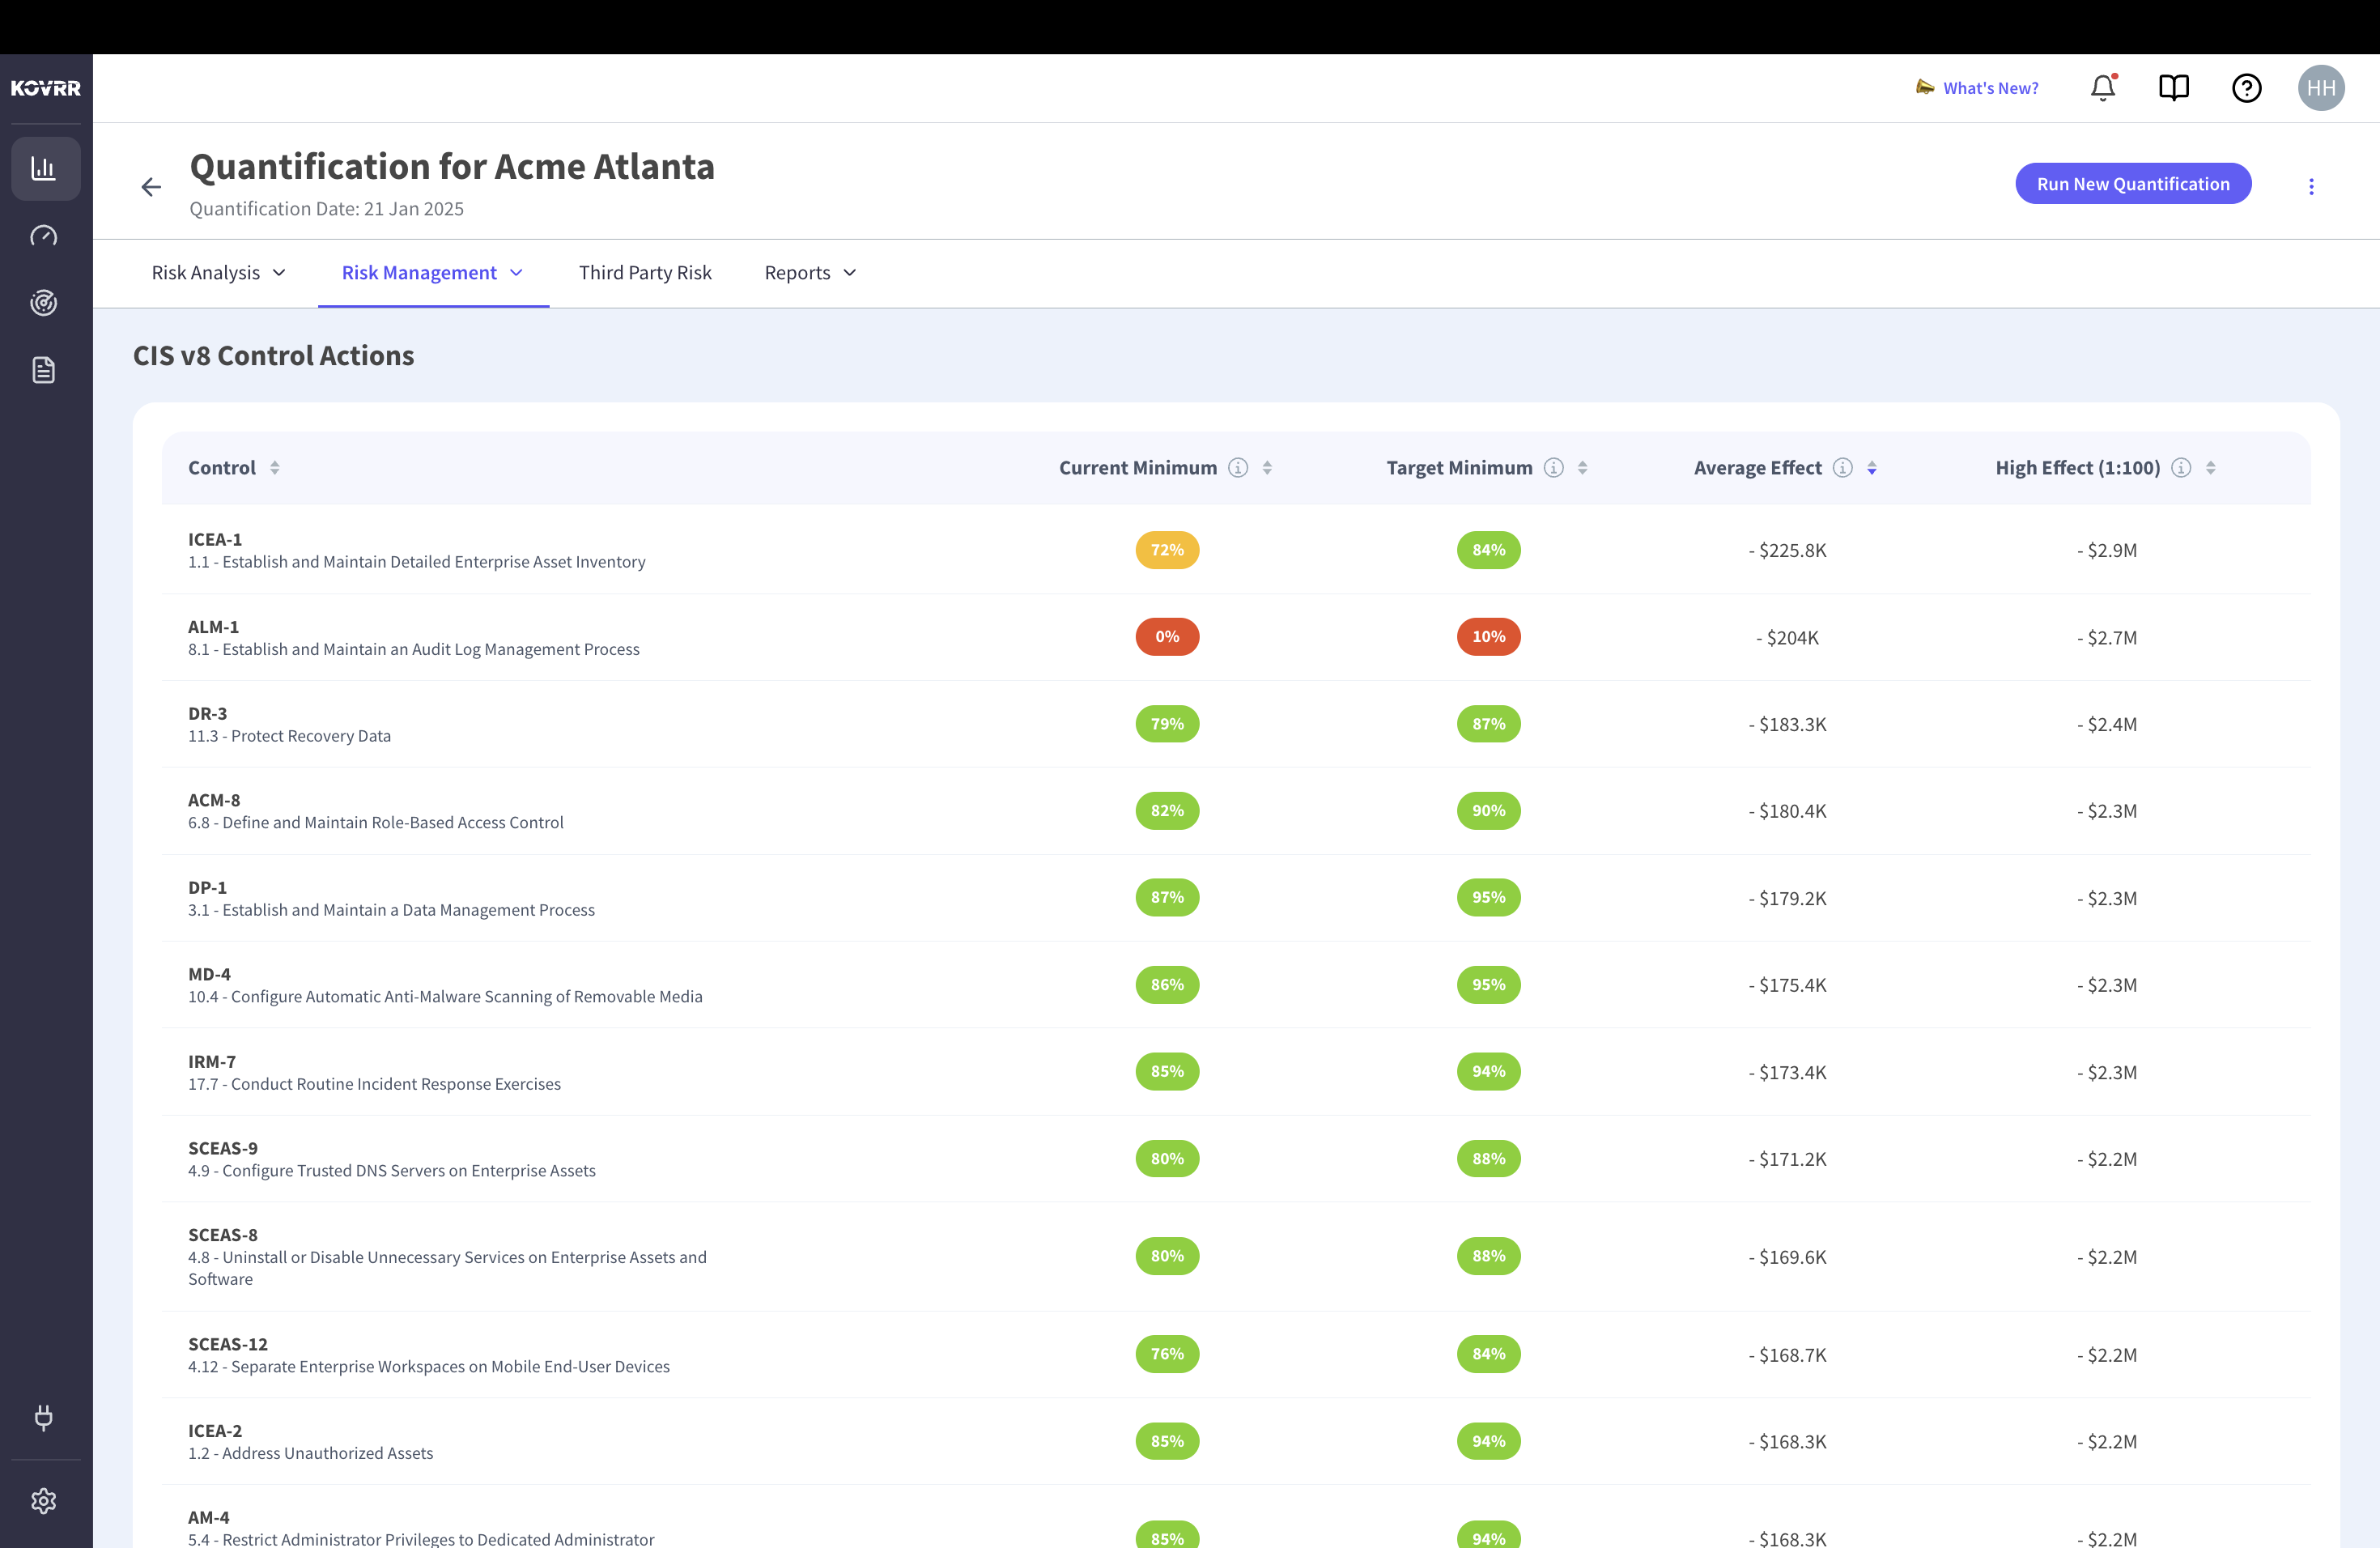
Modeled annual loss with the control at its current level, minus modeled annual loss with it at the target level, gives the annual accrual attributable to that weakness. Divide by twelve for a monthly figure. Nothing in that calculation is novel, and almost nobody reports it, because control assessment output arrives as maturity scores rather than as money. Running a control assessment produces the input and stops short of the conversion.
Two Weaknesses, Same Severity, Different Price
Consider two controls both rated high severity. One protects an asset carrying substantial modeled exposure and sits at low implementation. The other protects a peripheral system and sits at partial implementation. The severity rating treats them identically and the accrual figures can differ by an order of magnitude. Ranking by accrual is what risk-focused prioritization does when the risk is expressed in currency.
Time to Remediate Becomes a Financial Variable
Remediation service levels are widely missed, with practitioner analysis in 2026 finding programs failing their own stated windows more than half the time, and the observation that a service level nobody meets is not a control. Accrual explains part of why, because a queue ordered by severity gives a team no way to choose within the critical bucket. The framing changes sequencing in a way severity ranking cannot. A weakness accruing a moderate amount that can be closed in a week and one accruing more that takes nine months are not comparable on rate alone.
Dividing accrual by expected time to close produces a sequencing figure that favors fast fixes on substantial accruals, which is usually the correct order and rarely the order a severity queue produces. The same logic explains why a long-running remediation project can be the wrong first move even when it addresses the highest-rated weakness, since the accrual continues for the duration of the project.
Remediation Schedules Have a Carrying Cost
A twelve-month program to fix a weakness accruing a hundred thousand dollars a year carries a hundred thousand dollars of expected loss across its own timeline. Regression testing windows belong in that calculation too, since a mandatory testing period on a database or authentication system extends the window before deployment rather than after it. The carrying figure belongs in the business case alongside the implementation cost, and its absence is why return calculations sometimes understate the case for moving faster rather than more thoroughly.
Partial Implementation Is Not Half Protected
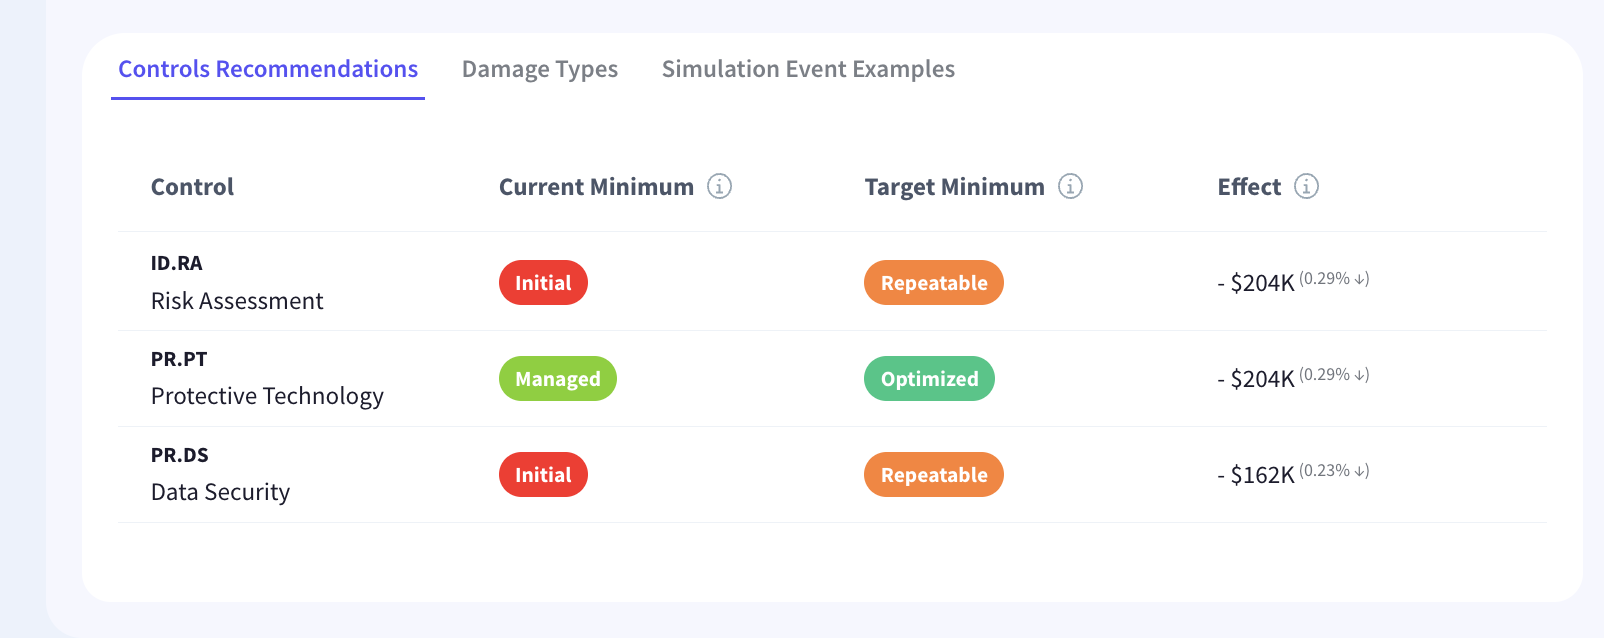
Control assessment output frequently records a maturity level rather than a binary state, and the financial effect of moving between levels is not linear. Moving from absent to basic often removes far more accrual than moving from managed to optimized.
Model the Transition, Not the Destination
Pricing a weakness against full implementation overstates what is available, because the last increment of maturity typically removes the least accrual for the most effort. Pricing the specific transition a team can realistically deliver this year produces a defensible figure. Control effectiveness expressed as a percentage rather than a status is what makes the increments visible.
Diminishing Returns Are Visible Before You Spend
Where the modeled floor with every control fully implemented sits close to current exposure, most of the available accrual has already been removed and the remaining weaknesses are cheap to leave open. The finding is legitimate rather than a failure, and it redirects budget toward transfer and resilience instead of further control work.
What a Compensating Control Buys
Compensating controls get described qualitatively, as mitigating or partially addressing a weakness. The accrual frame asks a sharper question, which is how much of the monthly figure the compensating measure removes while the primary control stays unimplemented.
Modeling the scenario with the primary control absent and the compensating measure present produces that number directly. The measures that appear in practice are specific rather than abstract, covering network isolation, filtering rules at the perimeter and detection signatures deployed while a patch clears regression testing. Sometimes it removes most of the accrual, which justifies deferring the primary fix indefinitely. Sometimes it removes very little, in which case the compensating control is documentation rather than mitigation. Compensating controls assessed this way stop being a way to close a finding and start being a decision with a figure attached.
Auditors Ask a Different Question
An examiner asks whether a compensating control addresses the risk the primary control was meant to address, which is a design question rather than a financial one. Both answers are needed, and the financial one is what tells management whether the arrangement should persist. Recording the accrual removed alongside the design rationale covers both audiences.
Accepted Risk Should Carry a Price
Every program has a backlog of weaknesses it has decided not to address. They sit in a register marked accepted, usually with no figure, and the accumulated accrual is nobody's number.
Summing the annual accrual across accepted items produces the amount the organization has chosen to carry, which is a considerably more useful disclosure than a count of open findings. It also makes acceptance reviewable, since an accepted weakness whose accrual has grown because the underlying asset grew is a decision worth revisiting. The figure travels outside the organization as well, since documented service level performance and a remediation log are what underwriters examine at renewal rather than a policy on file. Comparing that total against a stated risk appetite threshold is what turns acceptance into a governed position rather than a filing status.
Residual and Accepted Are Not the Same
Residual exposure is what remains after controls operate as designed. Accepted exposure is what remains because a control was deliberately not implemented. Conflating them hides a choice inside a calculation, and residual risk reported without separating the accepted portion tells a board less than it appears to.
Where the Accrual Frame Misleads
Three limits are worth stating, because the arithmetic is easy to over-apply.
- Accrual Is Not Linear in Time: Exposure to a specific campaign or a disclosed vulnerability concentrates rather than accruing evenly.
- Some Weaknesses Are Binary: A missing control that enables a single catastrophic path is poorly described by a monthly average.
- Compliance Obligations Ignore Accrual: A mandatory control has to be implemented whatever its modeled figure suggests.
The first is the one most likely to cause an error. Where a weakness is actively exploited in the wild, the expected loss for the next month is not one twelfth of an annual figure, and treating it that way understates urgency badly. Exploitability signals resolve this in practice, since published catalogs of known exploited vulnerabilities and probability scoring identify the items whose accrual concentrates now rather than spreading evenly. Those belong in an emergency queue rather than in the accrual model. Accrual is a planning tool for the standing backlog rather than a substitute for responding to live threat intelligence, and continuous threat exposure management handles the part that moves faster than a quarterly model.
Reporting It Without Overclaiming
Three presentation choices keep the figures defensible. State the model version and assessment date beside every accrual, since these numbers move when methodology moves. Report the accrual alongside the implementation cost rather than instead of it, because a weakness accruing less than the fix costs is a legitimate acceptance. Separate the standing backlog from anything under active exploitation, so the planning number and the urgent number are not confused.
Presented that way, the output answers a question boards ask and security teams struggle to answer, which is what the organization is currently paying for work it has not done. Turning that into a sequence rather than a list is what converting insight into mitigation decisions requires. Quantified board reporting gives that figure somewhere to sit alongside total exposure and control maturity.
Price the Interval, Not Just the Fix
Investment framing asks whether a control is worth implementing. Accrual framing asks what the delay costs, and the second question reorders a remediation queue, prices the accepted backlog, and tells you whether a compensating control is mitigation or paperwork. The arithmetic is a subtraction between two modeled positions, which most programs already have and few report. Kovrr's cyber risk quantification produces both positions from one model, so the difference is available rather than derived.
To see what your open control weaknesses are accruing per month against your own environment, book a demo with our cyber risk experts.

Pricing Control Weaknesses FAQs
Speak to an ExpertHow do you put a financial figure on a control weakness?

Why does accrual change the remediation order?
How should partial control implementation be priced?
What does a compensating control remove?
Should accepted risks carry a dollar figure?
When does the accrual approach mislead?