
Blog Post
Where Cyber Loss Comes From: Attack Vectors Ranked by Exposure
August 13, 2026
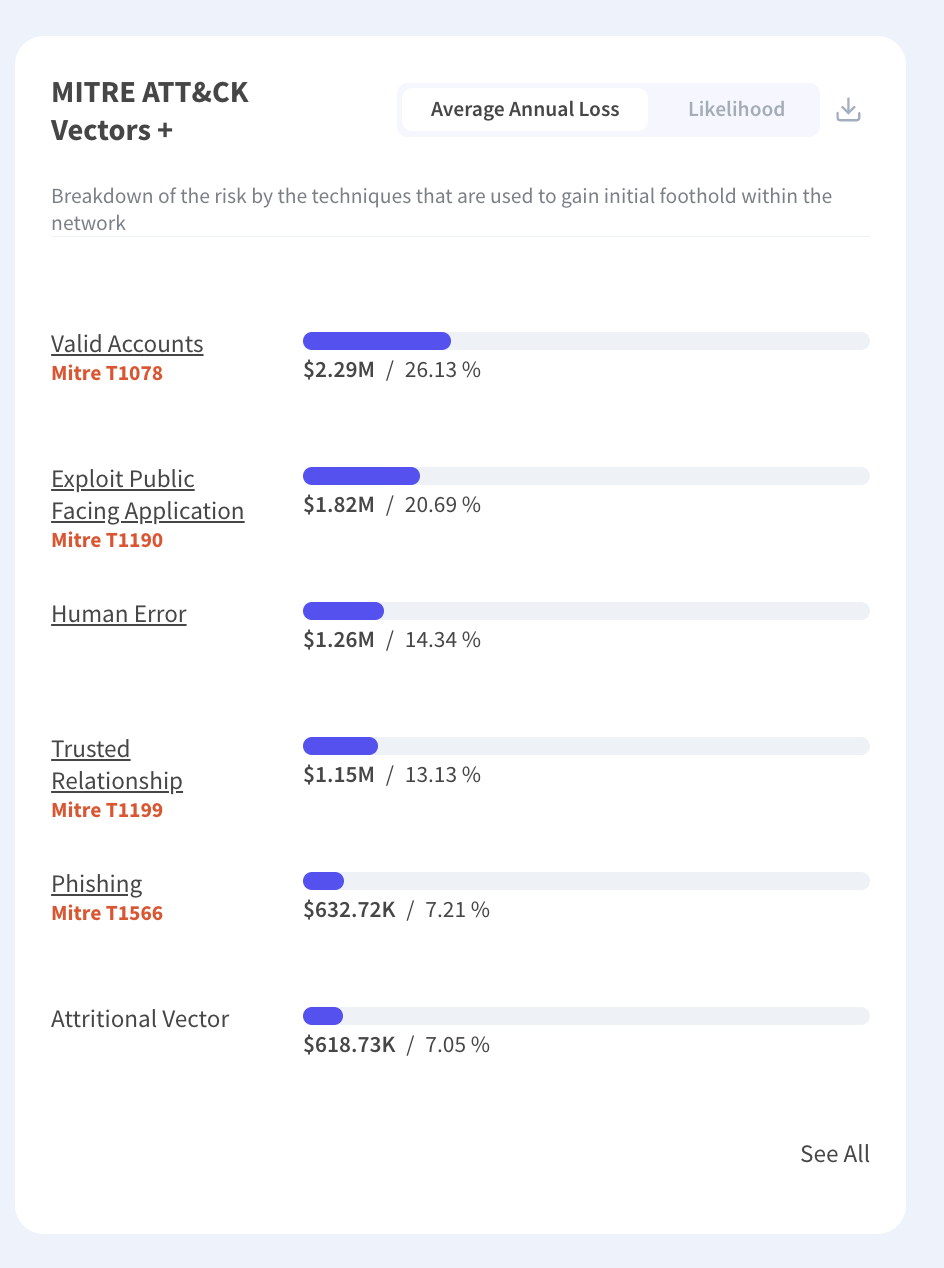
Security awareness receives a disproportionate share of attention relative to the exposure phishing carries. Modeled against initial access technique, valid account abuse accounts for around a quarter of expected annual loss in a typical portfolio, exploitation of public-facing applications around a fifth, and human error around a seventh. Phishing appears sixth, at roughly seven percent.
The obvious objection is that phishing is frequently how credentials are obtained in the first place, and the objection is correct. What follows works through why the ranking still matters, what it says about where controls belong, and how to read technique-level exposure without drawing the wrong conclusion.
Ranking Techniques by Loss Rather Than Frequency
Threat reporting counts incidents and security programs are funded against those counts. Counting tells you what happens often, which is a different question from what costs the most, and the two orders rarely match.
Valid Accounts Lead Because Nothing Interrupts Them
An attacker holding working credentials produces no malware detection, no exploit signature and no anomalous protocol. Detection depends on behavior rather than on artifacts, which most estates monitor thinly, so dwell time extends and the eventual loss grows with it. The technique does not lead because it is common, it leads because the controls that would shorten it are the ones least often present.
Public-Facing Exploitation Scales Without an Operator
Second position belongs to exploitation of internet-facing applications, where a single vulnerability reaches every organization running the affected software simultaneously. The loss distribution is therefore correlated in a way phishing campaigns are not, and correlated loss is what produces severe years. Aggregation through shared software is the same mechanism operating one layer down.
Why the Ranking Does Not Mean Phishing Stops Mattering
Initial access techniques are categories in a taxonomy rather than independent causes, and phishing frequently supplies the credentials that valid account abuse then uses. Reading the ranking as an argument against awareness training misunderstands what the categories represent.
The Useful Reading Is About Sequence
Phishing is an entry mechanism and valid account abuse is what follows, so the loss attributed to credentials is loss occurring after the phishing succeeded. Controls preventing entry reduce the number of attempts that proceed. Controls operating after entry reduce what each successful attempt costs. A program investing heavily in the first and lightly in the second has optimized for attempt count while leaving consequence untouched.
Prevention Rates Have a Ceiling
Awareness programs measurably reduce click rates and do not reduce them to zero, and the remaining fraction is sufficient given attempt volume. Accepting that some credentials will be obtained changes where the marginal control belongs, moving it toward detection of anomalous authenticated behavior, scoped permissions and rapid revocation. Human error sitting third in the same ranking reinforces the point, since error is not addressed by warning people harder.
Event Type Is Not Impact Type
Technique ranking answers how loss begins. Two further breakdowns answer what the loss consists of, and conflating the three produces confused prioritization.
Business Interruption Dominates Impact
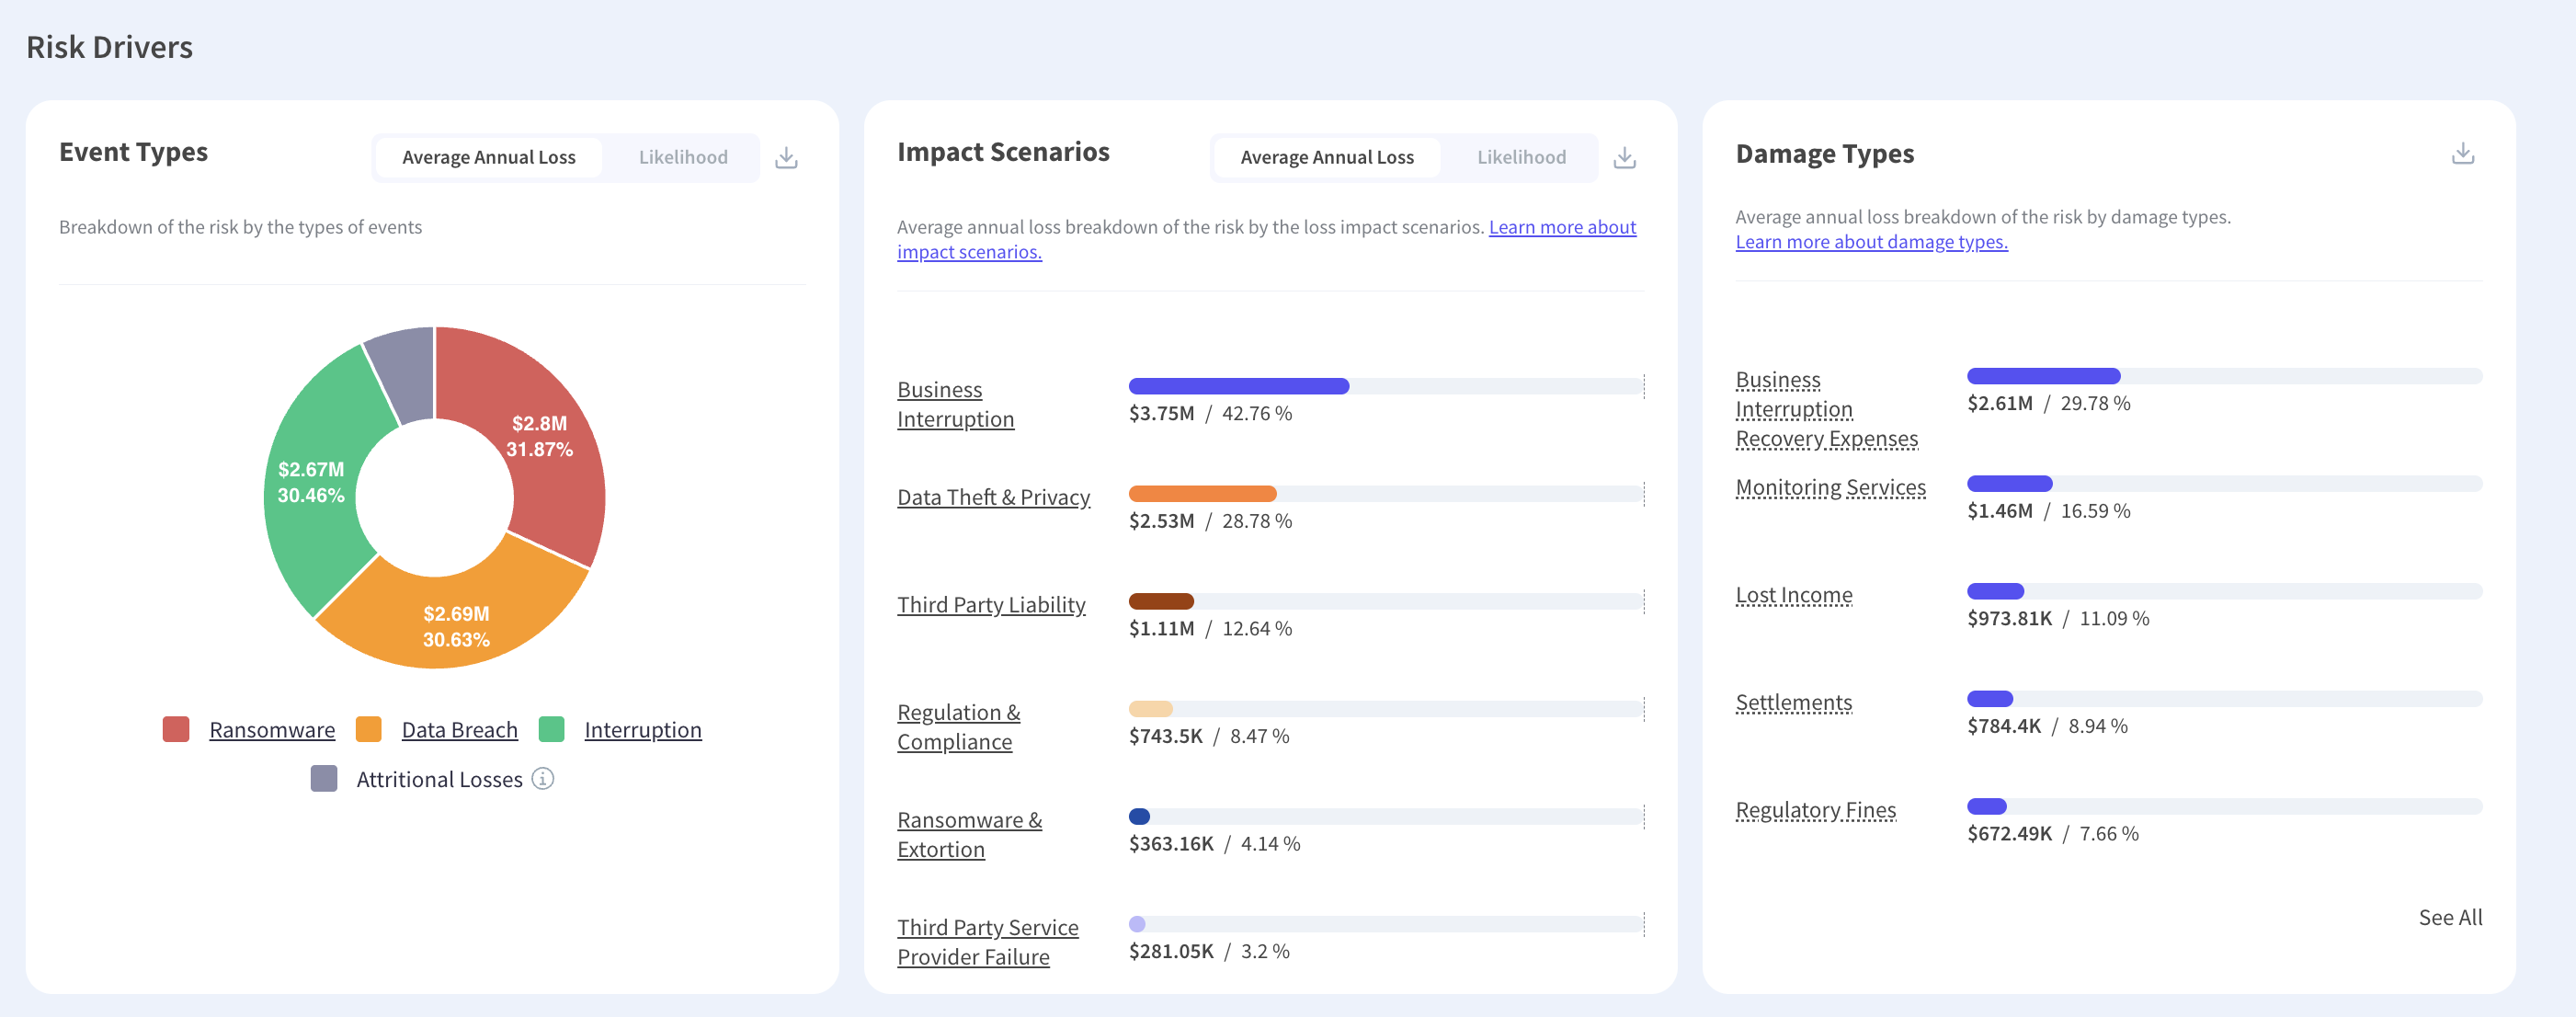
Breaking loss down by business impact rather than by attack type moves business interruption to the front, ahead of data theft and privacy. Security programs organized around confidentiality therefore mis-weight their own exposure, since the largest share of modeled loss arrives through things not working rather than through information leaving. Recovery capability competes with prevention for budget on those numbers, and modeled exposure by impact scenario is what makes the comparison possible.
Damage Type Determines Who Pays
The third breakdown covers where the money goes, including recovery expense, lost income, third-party liability, settlements and regulatory penalties. Composition matters because the mix moves with severity, and at extreme loss levels monitoring services and settlements displace interruption as the largest components. A control reducing one damage type may leave the others untouched, which is why reviewing loss scenarios across a year tends to reorder assumptions built from headline incidents.
Reading Peer Data Without Copying It
Published incident data describes what happened to other organizations, and the value depends entirely on which other organizations. A ransomware event at a nine million dollar company and one at a billion dollar company differ in every respect that matters for planning.
Filtering peer events by industry, revenue band and geography produces a comparison set with transferable base rates, and the unfiltered version produces headlines. Scenario intelligence exists to make that filtering the default rather than a manual step. Sector concentration also means the techniques leading in one industry differ from another, so a general ranking is a starting point rather than a conclusion. Feeding those events into scenarios rather than reading them as news is the step most programs skip, and bringing real-world events into the register covers the mechanism.
Base Rates Belong in the Model
A peer base rate is useful as a calibration input rather than as a benchmark to be beaten. An organization modeling a lower event likelihood than its peer group has either better controls or an optimistic model, and only one of those is good news. Comparing the two explicitly is how peer benchmarking earns its place rather than producing a reassuring slide.
What This Changes in Practice
Three reallocations follow from reading exposure by technique rather than by incident count.
- Identity Over Perimeter: Detection of anomalous authenticated behavior addresses the technique carrying the largest share.
- Exposure Management Over Patch Cadence: Internet-facing surface reduction attacks the correlated second position directly.
- Recovery Over Prevention at the Margin: Business interruption leading the impact breakdown argues for continuity investment.
None of these argues for removing awareness training, which remains cheap relative to its effect and is frequently mandatory. The argument is about the marginal dollar, and marginal reasoning is what risk-focused prioritization supplies once techniques carry figures. Mapping controls to the techniques they interrupt, rather than to framework categories, is what makes the connection visible. Continuous testing then confirms the mapped controls are operating, since control monitoring answers a question a technique ranking cannot.
Technique Mapping Has Limits
Attributing modeled loss to a single initial access technique simplifies chains that involve several, and any model doing this makes allocation choices worth understanding before quoting the percentages. The ordering is more robust than the exact figures, which is the appropriate level of confidence to hold. Sector variation compounds this, since the technique leading in financial services need not lead in manufacturing, and an organization inheriting a general ranking without checking its own modeled distribution has swapped one assumption for another. Methodology matters here, and quantification built on MITRE ATT&CK sets out how the mapping is performed.
Counting Incidents Is Not Measuring Exposure
Threat reporting produces frequency and security budgets need consequence, so the translation between them is where prioritization is won or lost. Valid account abuse leading the ranking, public-facing exploitation second and phishing sixth is a statement about where loss accumulates rather than about where attacks begin, and both facts are worth holding at once. Kovrr's cyber risk quantification attributes modeled loss to technique, event type and damage type from the same model, so the three views stay consistent.
To see which initial access techniques carry the most exposure in your own environment, book a demo with our cyber risk experts.

Attack Vector Exposure FAQs
Speak to an ExpertWhich attack techniques cause the most cyber loss?

Does this mean phishing training is not worth doing?
Why does business interruption exceed data breach in modeled loss?
How should peer incident data be used?
What is the difference between event type, impact scenario and damage type?
How reliable is attributing loss to a single technique?