
Blog Post
One Cyber Risk Model, Three Subtractions
September 2, 2026
Three parties ask an organization what a cyber event would cost, and each means something different by the question. A regulator asks whether a specific incident was material. An underwriter asks what covered loss to expect over a policy year. A board asks how much the organization stands to lose in total.
Programs frequently answer each with a separately produced figure, and the three disagree. The disagreement is usually not an error in any of them. It is a consequence of building three models to three definitions rather than one model with three filters applied.
What Does Each Party Mean by Loss?
Three differences run underneath, and scope is only the first of them.
Scope differs because insurance covers a defined subset. Fines are uninsurable in several jurisdictions, reputational harm is largely excluded, and internal management time is not a covered category anywhere. An appetite figure includes all of those, since the organization bears them regardless of whether anyone will pay for them.
The net or gross basis differs next. An insurance figure is naturally expressed after retention and within limits, because that is the part being transferred. An appetite figure has to be gross, since the retention is precisely the part the organization carries. Presenting a net figure to a board understates what the business is exposed to by the entire retention.
The Time Basis Differs Too
This one is missed most often and produces the largest apparent contradictions. Materiality is assessed per incident and retrospectively, for an event that has occurred. Insurance is priced per policy year and prospectively. Appetite is stated as an annual position, also prospective. Two figures can therefore be entirely consistent and look nothing alike, because one describes a single event and the other describes a year containing several.
Why Do Three Models Produce Three Irreconcilable Numbers?
Because the adjustments run in one direction only. A figure modeled to a narrow definition cannot be expanded back to a wider one, while a wide figure can always be narrowed.
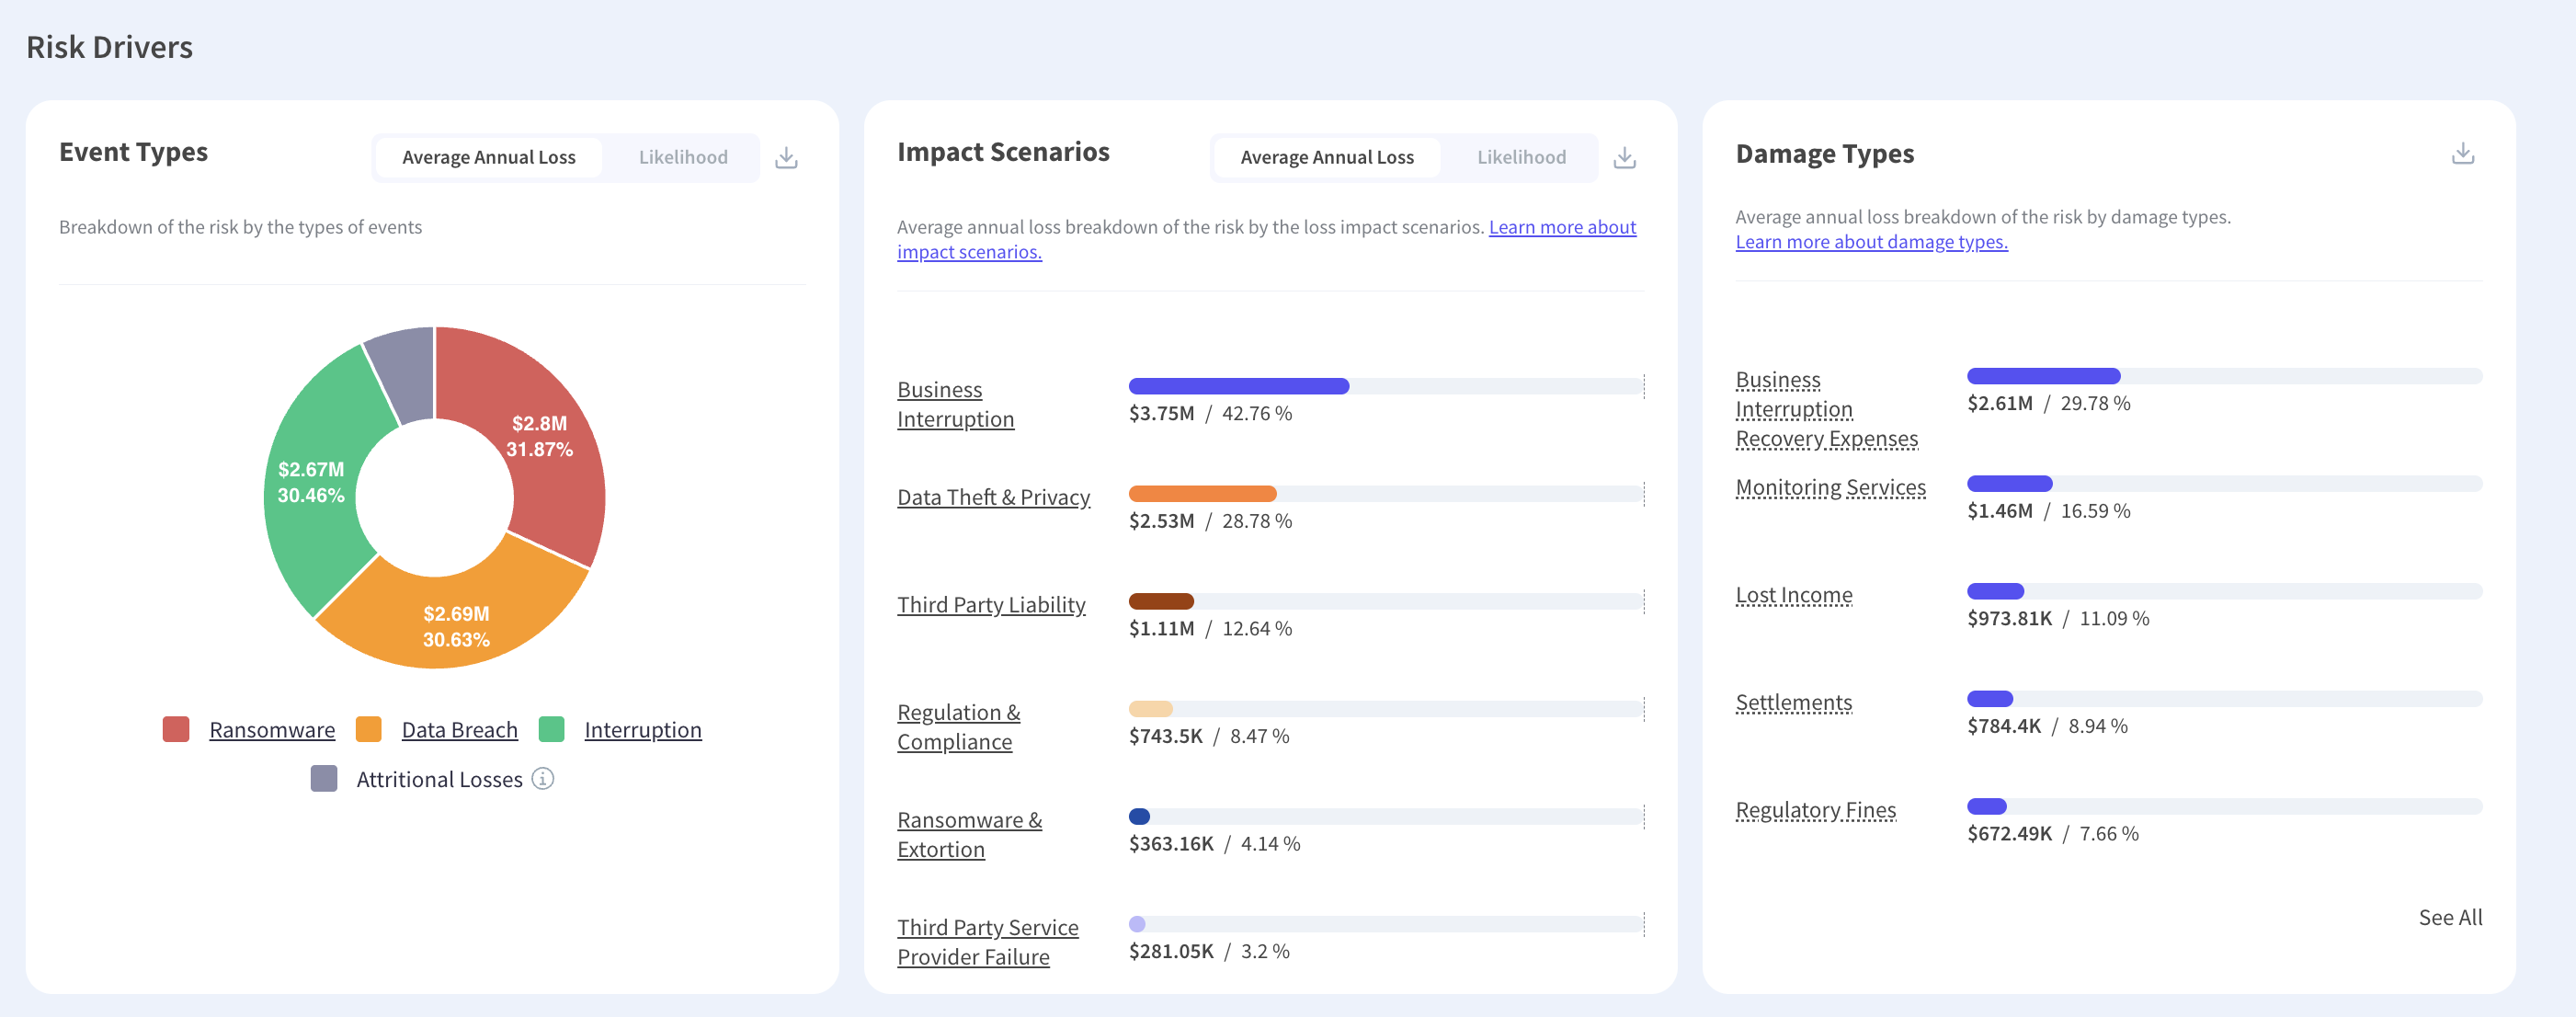
Model net of retention and the gross figure is unrecoverable, because the retention was applied before the distribution was built rather than after. Model only insurable categories and the appetite figure cannot be produced, since the excluded costs were never estimated. Model a single severe event and no annual position exists. Each shortcut saves effort once and forecloses two of the three answers.
What Is the Rule That Avoids It?
Model gross, unfiltered and by component, then subtract. Never model filtered and attempt to add back. Doing so means estimating loss by damage type across all categories including the uninsurable ones, before any retention, limit or coverage definition is applied. Every narrower view is then a subtraction from that base, and all three reconcile by construction because they descend from the same figure.
What Does Each Filter Remove?
Stating the filters explicitly is what makes the three numbers defensible when somebody puts them side by side.
- Insurance View: Remove uninsurable categories, apply the retention, cap at each sub-limit and the aggregate, and express per coverage line.
- Materiality View: Take a single event rather than the annual aggregate, keep all categories including reputational, and add the qualitative factors no model contains.
- Appetite View: Take the gross annual aggregate across all categories with nothing removed.
Documenting each as a stated transformation from the base figure means a reviewer can reproduce any of the three, which is the property that survives an examination. It also means a change to the base model propagates to all three rather than leaving two of them stale, and presenting the same analysis to different audiences becomes a formatting exercise rather than a fresh derivation.
Can a Model Tell You What Is Material?
No, and treating a modeled figure as the materiality threshold overstates what quantification does. Materiality is a judgment about what would matter to a reasonable investor, and a quantitative estimate is one input to that judgment rather than the answer.

Qualitative factors sit outside any loss model. Whether the incident reveals a systemic control weakness, whether it affects a business the market considers strategic, whether it invites regulatory attention wider than the disclosure itself. Those can make a numerically small event material and a numerically larger one not, which is why bright-line quantitative tests are treated with suspicion, and data-driven loss thresholds inform the judgment rather than replacing it.
What Is the Model Good For Here?
Establishing the range in advance so the judgment is not made from scratch under time pressure. Knowing beforehand what a given scenario class typically costs turns an incident-day question into a comparison against prepared work, and materiality determination is considerably harder when the first estimate is produced while the incident is still running.
What Sits in the Gross Figure and Nowhere Else?
Four cost categories appear in a complete exposure figure and drop out of both narrower views, which is why an organization working only from an insurance model consistently understates what it carries.
Regulatory fines are uninsurable in several jurisdictions, so they sit outside the transfer view while remaining a real cost. Internal response effort is substantial and unclaimable, covering the executive and technical time an incident consumes across weeks. Customer attrition following an event is difficult to attribute and rarely covered. Opportunity cost completes the set, meaning the initiatives that stalled while the organization responded, appears in no policy and on no disclosure.
Are Those Worth Estimating at All?
Yes, though with wider ranges than the covered categories, and stating the range plainly is better than omitting the category. A figure that excludes them is not conservative, it is incomplete in a direction that flatters the position, and a board making a retention decision from it is deciding against a number that leaves out several of the costs it would bear.
Which One Is Most Often Missing?
Internal response effort, because no invoice records it. The cost appears as people doing incident work rather than their normal jobs, which shows up in delayed projects rather than in a line item. Estimating it requires a view of how many people at what level for how long, which pricing an open exposure needs anyway.
When Do the Three Numbers Collide?
During an incident, which is the worst possible moment and entirely predictable.
Within the same week, somebody produces a materiality assessment for disclosure, somebody notifies the insurer with a preliminary loss estimate, and somebody briefs the board. If those three come from three different models maintained by three different functions, they will differ, and the differences will be visible to parties who compare documents afterward.
Which Comparison Causes the Most Difficulty?
A disclosure stating one figure alongside an insurance claim stating another, where nobody recorded why they differ. The explanation is usually legitimate, being scope and net against gross, and it is considerably more convincing when written down in advance than when reconstructed under scrutiny. Recording the transformation between the two before an incident costs an afternoon.
Which Number Should the Board See?
The gross annual figure, because that is what the organization carries, with the other two presented as derived views rather than as alternatives.
A board shown only the insurance figure sees what a third party would pay and not what the business stands to lose, which understates the position by the retention plus every uninsurable category. A board shown only a materiality threshold sees a disclosure trigger rather than an exposure. Presenting the gross figure with the transfer and disclosure views beneath it answers all three questions in one slide and shows how they relate, and an appetite threshold that can be breached has to sit against the gross number to mean anything.
What Should You Check This Quarter?
Four questions establish whether your three numbers descend from one model or from three.
Whether the base model is gross of retention, since a net base forecloses the appetite view. Whether uninsurable categories are estimated at all, since they are frequently omitted when the model was built for a renewal, and what a policy excludes determines which categories those are. Whether the annual aggregate and the single-event figures come from the same distribution. Finally, whether the transformations between views are written down anywhere, or whether each number is produced by a person who knows how without documenting it.
What Usually Turns Up?
Usually that the model was originally built for one audience, most often insurance, and the other two views are adjusted versions produced by hand. The arrangement works while the same person does it and breaks when they are unavailable, which tends to be during the incident when all three are needed at once.
Does This Change Who Owns the Model?
It should, and the ownership question follows directly from the architecture.
Where three functions each maintain a model for their own purpose, each is optimized for one audience and none is authoritative. Where one model produces all three views, somebody has to own the base and the transformations, and that owner cannot sit inside any of the three consuming functions without the model drifting toward their view over time.
Where Should It Sit?
With risk rather than with insurance, compliance or finance, since the base figure is the organization's exposure rather than any one function's working number. The consuming functions then receive derived views and can challenge the transformation applied to them, which is a healthier arrangement than each maintaining a private version nobody else can reproduce.
One Model, Three Subtractions
A regulator, an underwriter and a board are asking genuinely different questions, and the differences run deeper than presentation. Scope differs because insurance covers a subset. Basis differs because transfer is naturally net and exposure is naturally gross. Time differs because materiality is a single retrospective event and the other two are prospective years. Building to the widest definition and documenting each narrowing means all three reconcile by construction, while building three models means explaining the differences under pressure. Kovrr's cyber risk quantification models loss by damage type before any coverage definition is applied, which is what makes the narrower views derivable.
To see gross exposure by damage type with the transfer and disclosure views derived from it, book a demo with our cyber risk experts.

Loss Definition FAQs
Speak to an ExpertWhy do regulatory, insurance and appetite figures differ?

Why can't three separately built models be reconciled?
What is the rule for building the base model?
Can a model tell you what is material?
When do the differences between the three numbers cause problems?
Which figure should a board be shown?