
Blog Post
When the Loss Is Downtime Rather Than Data
September 8, 2026
Most cyber loss models are shaped around a breach. Records exposed, notification cost per record, regulatory penalty, credit monitoring, litigation. The arithmetic is well established and the inputs are reasonably well evidenced.
Apply that model to an outage where nothing left and nothing was taken and every one of those categories returns zero. The organization was down for four days and the model reports almost no loss, which is not a calibration problem but the wrong model.
What Do the Two Models Measure?
Different primary quantities, and everything else follows from that.
A breach model measures volume. How many records, of what type, under which jurisdictions, with per-record costs and penalty exposure attached. The unit is a count and the loss scales with it in a reasonably predictable way, which is why breach modeling matured first, and where cyber loss comes from reflects that maturity in the available data.
An interruption model measures time. How long a service is unavailable, and what each additional hour costs. The unit is duration and the conversion to money runs through operational rather than legal inputs, which is a different set of people and a different set of records.
Why Doesn't Duration Convert Linearly?
Because the cost per hour rises as the outage continues, and a model treating duration linearly understates the tail substantially.
The first hour is absorbed by slack in the system. Work queues, staff catch up, nobody outside notices. The backlog then has to be worked through at overtime rates by the end of a day, and by day three contractual service commitments start breaching, customers begin making alternative arrangements, and recovery is competing with continuing operations for the same people.
The Shape Matters More Than the Average
An average outage duration multiplied by an average hourly cost produces a figure that is wrong in a specific direction. The useful output is the distribution of duration with a cost curve applied to it, since the extreme case is driven by the long outages where the per-hour cost is highest, and reading a distribution at the average or at a return period gives different answers for exactly this reason.
Who Can Estimate This?
Operations, and they are rarely in the risk modeling conversation. The absence is why interruption exposure tends to be the least well-supported part of an otherwise careful model.
The people who know what a plant produces in a working day, what a claims department processes per day, what the contractual service commitments are and how long manual workarounds remain viable sit in operations and service delivery. Legal and privacy supply the breach inputs and have no view of any of that, so a model assembled through the usual channels arrives with strong record-side inputs and guesses on the duration side.
What Should They Be Asked?
Four questions, none of which requires them to understand the model. What does this service produce or process per hour. At what point does a delay breach a commitment to somebody outside. How long can the manual process run before it fails. Then what catching up afterward costs. Those four convert a duration distribution into money more reliably than any external benchmark.
Is Duration Easier or Harder to Estimate Than Records?
Easier, which surprises people and is the most useful thing in this comparison. Organizations generally have better evidence about their own recovery than about their own breach exposure.
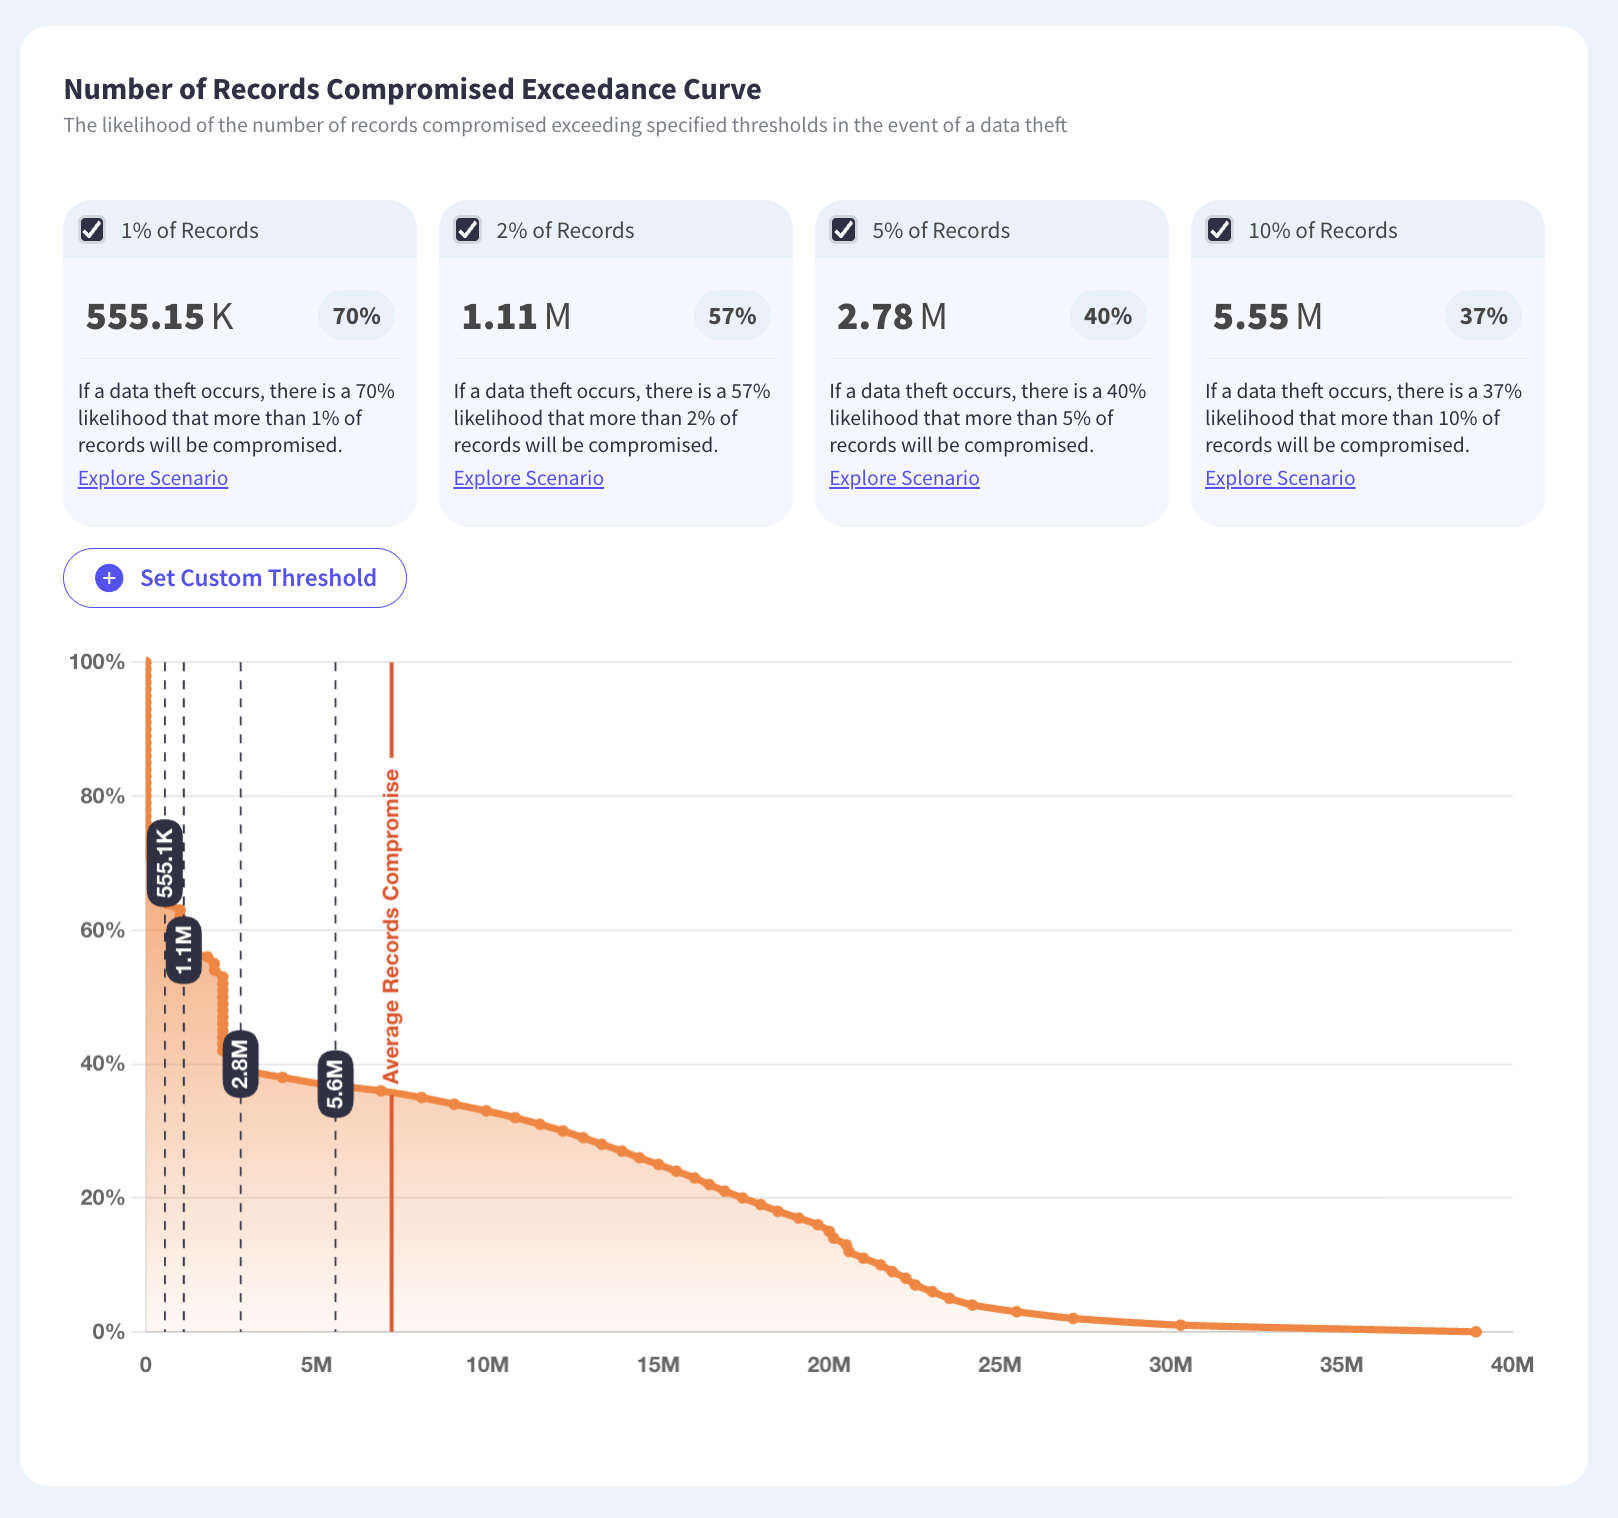
Record counts come from data inventories that are frequently incomplete and from assumptions about what an attacker would reach. Recovery duration can be measured directly, because restoration tests, failover exercises and past unplanned outages all produce observed times. An organization that has run a restore knows something about its own recovery that no external dataset could tell it.
Which Makes the Testing Doubly Valuable
A restoration test produces both a control assurance and a model input. The elapsed time is the anchor for the duration distribution, and a test that took considerably longer than planned is a more informative input than a successful one, and testing on a cadence rather than once gives the distribution more than one point to rest on.
How Does This Interact With Insurance?
Directly, and in a way records-based loss does not, because interruption coverage carries a structural feature that only bites on duration.
A waiting period means the policy responds only after the outage has run for a defined time, so the modeled duration distribution against that threshold determines whether coverage fires at all. A twelve-hour waiting period against outages concentrated below twelve hours describes cover that will rarely respond, which is a finding available before renewal rather than after a claim, and sizing a program against the distribution is where it belongs.
The Sub-Limit Problem
Interruption sub-limits are frequently set well below the aggregate and frequently sized years earlier when the organization had fewer dependencies. Where interruption is the largest component of modeled loss, as it often is, the headline limit can look generous while the layer that would respond is capped at a fraction of it.
What About Somebody Else's Outage?
Contingent interruption is the harder half and the part most models handle worst, because the duration is determined by a recovery capability the organization cannot observe.
A vendor outage stops your service and you have no view of their restoration progress, no ability to accelerate it and frequently no contractual remedy proportionate to the loss. Your own recovery testing tells you nothing, since the constraint sits outside. The workable substitute is asking vendors for their recovery objectives and treating the answer as a claim rather than a measurement, since assessing third parties rarely reaches an evidenced recovery time.
Which Dependencies Deserve the Question?
The ones where your service stops rather than degrades. A vendor whose failure slows a process is a different exposure from one whose failure halts it, and most organizations can name the second category in a meeting, which concentration on a shared dependency then prices. Asking those vendors for tested recovery times, and recording who answered with evidence rather than with a target, produces a usable input.
Which Sectors Does This Hit Hardest?
The ones where output stops rather than slows, and the distinction is sharper than sector labels suggest.
Manufacturing and logistics lose production that cannot be recovered later, since a line down for two days does not run at double speed afterward. Healthcare and utilities face consequences that are not financial at all before they become financial. Financial services frequently degrade rather than stop, with manual processes absorbing more than people expect. Professional services can often work around an outage for days at a cost measured in billable hours rather than in lost contracts.
What Determines the Difference?
Whether the work can be caught up. An organization whose output is recoverable after the fact has a cost curve that flattens, because the loss is the cost of catching up rather than the value of what was not produced. One whose output is perishable has a curve that keeps rising, since every hour represents production that is gone. Asking which of those applies is a faster route to the right shape than any sector benchmark, and quantifying industrial exposure starts from exactly that question.
Does That Change Where the Controls Go?
It changes what they are for. Where output is perishable, recovery speed is the control that matters and every hour removed is money. Where output is recoverable, preventing the outage matters more than shortening it, because a shorter outage still produces the catch-up cost. The two lead to different investment priorities from the same exposure figure.
What Changes in the Model?
Three things, and none requires a different engine.
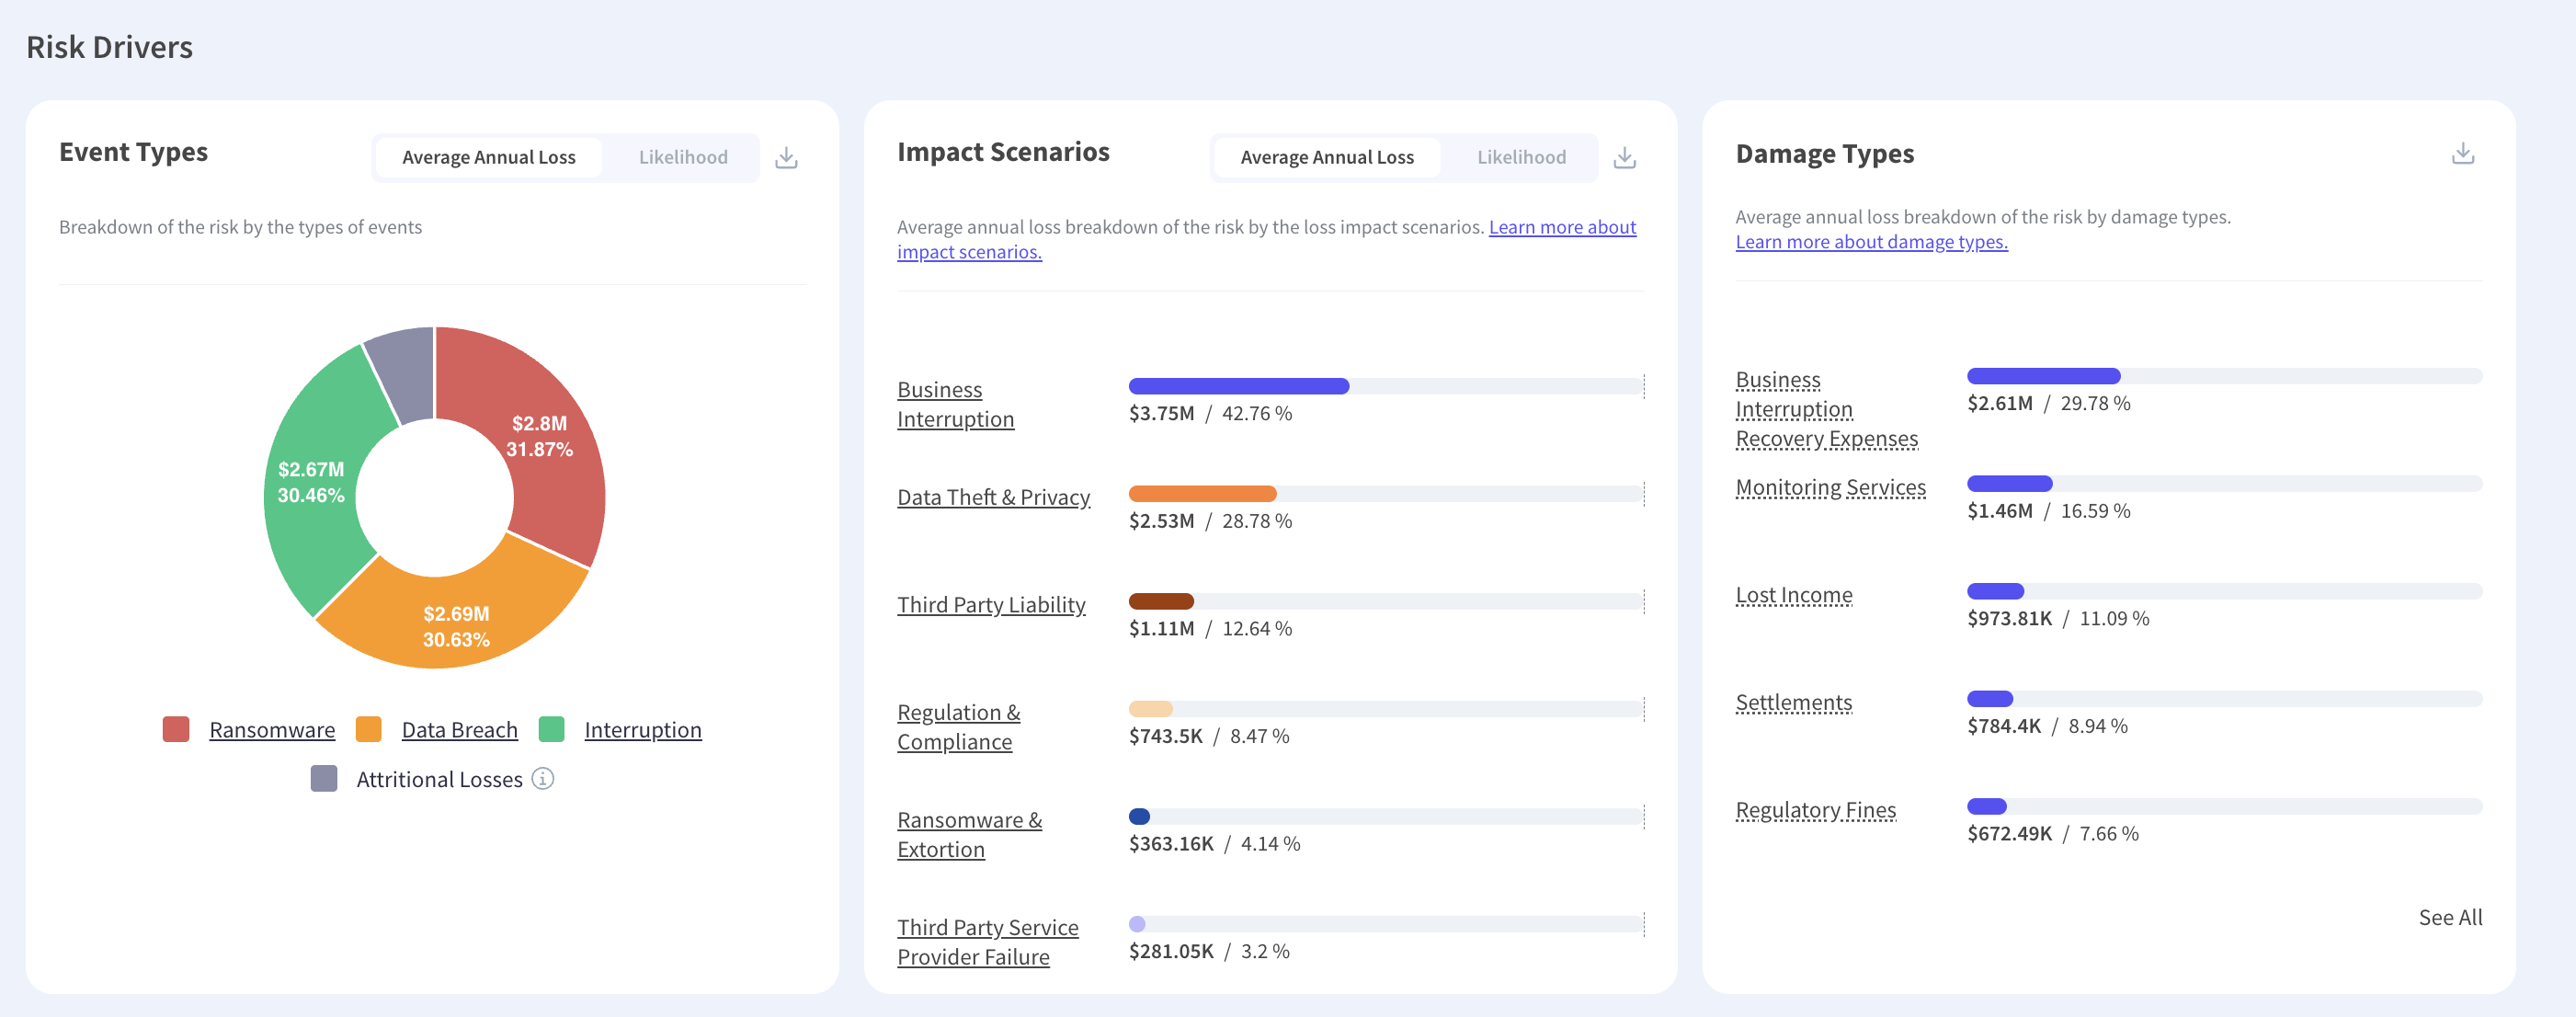
Model duration as its own distribution rather than as a severity input, since the questions that matter are about how long. Apply a rising cost curve rather than an hourly average, because the last hour of a long outage costs more than the first. Then separate interruption from data loss in the output, so the two can be read against the sub-limits and waiting periods that apply to each. Cyber risk quantification, or CRQ, that reports damage types separately makes all three visible rather than blended into a single figure.
Time Is the Unit
A breach model measures volume and an interruption model measures time, and applying the first to an outage returns close to nothing because every category it prices is zero. Duration does not convert linearly, since slack absorbs the first hour while day three brings contractual breaches, customer defection and recovery competing with operations for the same people. The people who can estimate any of that sit in operations rather than in legal. Duration is also the better-evidenced input of the two, because restoration tests produce observed times where record counts rest on assumptions. Kovrr's CRQ models outage duration as its own distribution, which is what allows waiting periods and interruption sub-limits to be tested against it.
To see modeled outage duration alongside the waiting periods and sub-limits in your current program, book a demo with our risk experts.

Interruption Loss FAQs
Speak to an ExpertWhy does a breach model fail on an outage?

Why doesn't outage duration convert linearly to cost?
Who can estimate interruption loss?
Is duration easier to estimate than record counts?
How does interruption modeling interact with insurance?
What about a vendor's outage rather than your own?