
Blog Post
Quantifying OT Cyber Risk Without a Loss History
August 21, 2026
Quantifying cyber risk in an enterprise IT environment starts from frequency. Incidents of a given type happen at some rate, that rate is observable across enough organizations to be estimated, and severity follows from what was affected.
Operational technology inverts both halves. Frequency data barely exists, and the consequences are already documented in detail by people who have never thought about cyber. Working with that inversion rather than against it is what makes the modeling tractable.
Enterprise Loss Data Does Not Transfer
Three reasons, and none of them resolves with a larger dataset.
Breach databases record records compromised, notification costs and regulatory penalties, which describe an event class with no relationship to a pressure excursion or a production line stopping. Industrial operators also share far less than enterprise IT does, since incidents carry reputational, legal and in some sectors national security sensitivities that suppress disclosure well past the usual reluctance. The events that matter most are rare enough that even complete reporting would leave the tail thinly populated.
Borrowing Anyway Produces Confident Nonsense
The tempting move is to take an enterprise base rate and adjust it. The output looks like a quantified figure and carries none of the evidentiary weight, because the underlying population describes a different kind of event entirely. An engineering audience will identify that faster than a security audience will, which is why model credibility rests on the inputs rather than the output.
Likelihood Is the Wrong Variable
A second problem sits underneath the data problem. Frequency estimation assumes events arrive from a process that behaves consistently, and targeted intrusion into industrial environments does not behave that way.
Capable adversaries act when intent, capability and opportunity align rather than at a background rate. Meanwhile the susceptibility side approaches certainty in many plants, because equipment installed two decades ago cannot be patched, cannot be taken offline for maintenance windows, and was designed for availability rather than authentication.
Express It Conditionally Instead
The workable formulation states the condition rather than hiding it in a probability. Given an adversary who reaches the control network, what follows, and how long does it take to detect and restore. The formulation produces a figure engineering leadership can argue with on its merits, and it separates the part resting on evidence from the part resting on a judgment about threat.
Start From Consequence and Work Backward
The approach that works in this environment reverses the usual direction. Rather than asking what is likely and deriving impact, it identifies the outcomes that would genuinely damage the organization and traces which digital pathways could produce them.
Methodologies developed for critical infrastructure formalize this, assuming the adversary is already inside and concentrating analytical effort on the handful of events capable of destroying equipment, halting production or endangering people. The value is in the narrowing, since a plant has thousands of digital assets and perhaps a dozen consequences worth this level of attention. Prioritizing that way is what risk-focused control prioritization does with the result.
The Physical Chain Has to Be Explicit
Each consequence needs its pathway written out, from the digital action through the control system behavior to the physical result. A command changing a setpoint, a controller acting on it, a process variable moving outside its safe range, a protective system either intervening or not. Writing that chain is what turns a vague concern into something with an owner and a control, and scenario-based modeling depends on the chain being specific.
Most of the Consequence Work Already Exists
This is the part security teams routinely miss, and it removes most of the perceived difficulty. Process safety functions have been quantifying these outcomes for decades, for reasons entirely unrelated to cyber.
Hazard studies, process hazard analyses and safety integrity assessments already document what happens when a vessel over-pressurizes, a line loses containment or a unit trips unexpectedly. They carry equipment replacement costs, environmental remediation estimates, regulatory exposure and production loss figures, produced by engineers and accepted by the business.
The Cyber Question Is Narrower Than It Looks
Given that work exists, the security contribution is not modeling the consequence. It is establishing which of those already-quantified outcomes a digital pathway can now reach, given connectivity that did not exist when the original analysis was performed. The remaining question is much smaller, it has engineering colleagues who can answer it, and it produces figures the organization has already agreed to.
What Changes in the Loss Model
Three components behave differently from an enterprise data event and need modeling on their own terms.
- Duration Dominates: Restoration is constrained by physical processes and equipment lead times rather than by restoring from backup.
- Replacement Is Real: Damaged equipment carries procurement timelines measured in months, and specialized items may have single suppliers.
- Consequences Reach Third Parties: Environmental release, downstream supply interruption and public safety exposure sit outside the organization's own balance sheet.
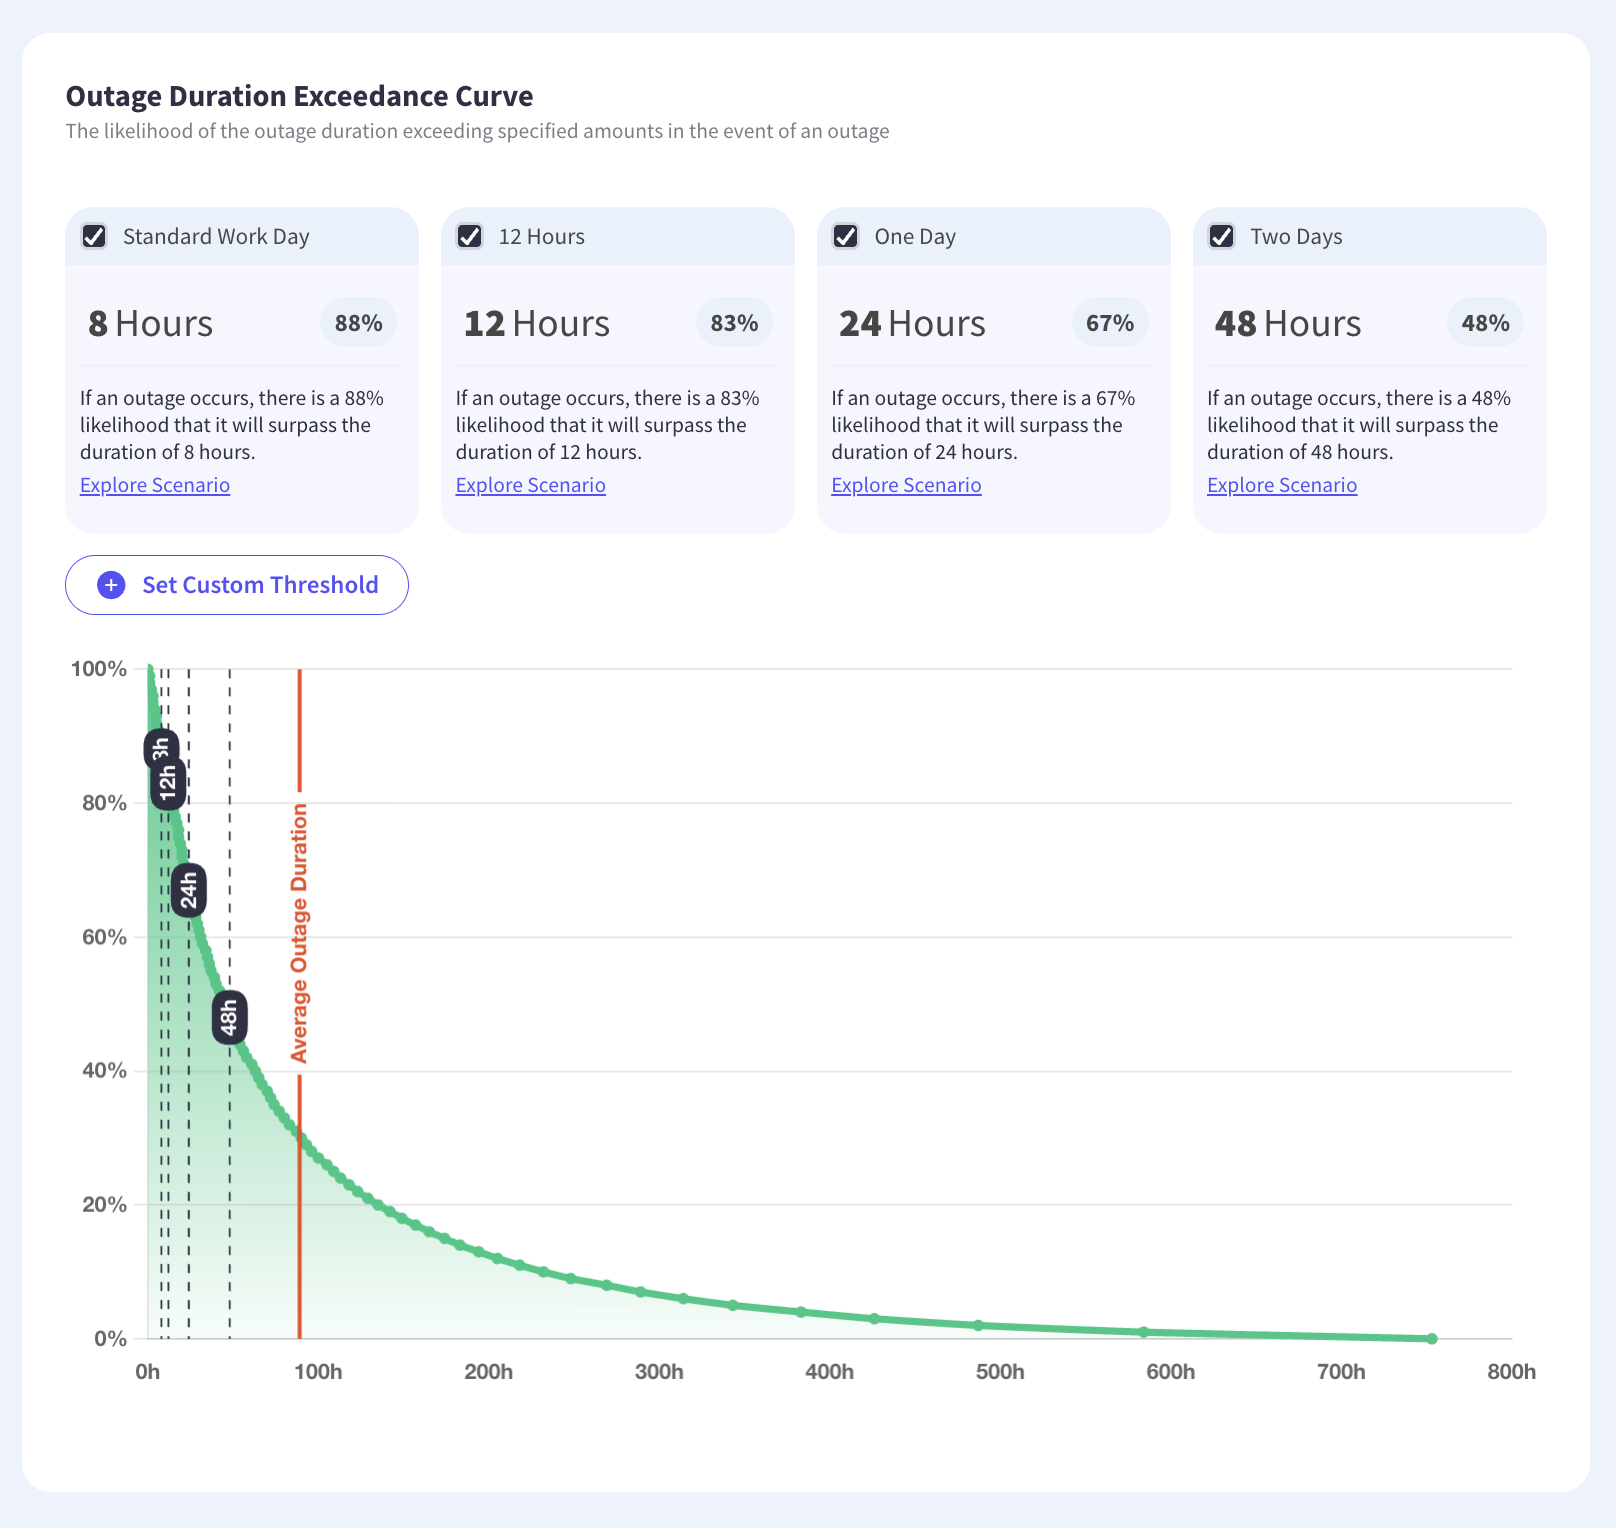
The distribution shape differs as well. Enterprise cyber loss has a long attritional body with a tail, while industrial cyber loss tends toward the discrete, since a plant is either operating or it is not. Modeling that with a smooth distribution understates both how often nothing happens and how bad the exceptions are, which is why reading the exceedance curve matters more here than a central estimate.
Where the Two Models Meet
Very few industrial incidents begin in the control network. They begin in enterprise IT and traverse a boundary that has become considerably more permeable than the architecture diagram suggests, through remote access for vendors, historian replication, shared directory services and connectivity added for operational reporting.
The frequency term for an industrial consequence is therefore largely an enterprise IT number, which is estimable, while the severity term is an engineering number, which is documented. Splitting the model along that line uses evidence where it exists on both sides. Governance frameworks covering enterprise technology, including COBIT, apply cleanly to the boundary controls even where they say little about the process environment itself.
Model the Boundary Explicitly
Every crossing point deserves recording as a pathway with its own controls, because these are where an estimable frequency meets a documented consequence. Vendor remote access is usually the largest of them and the least governed, and third-party access assessed across the portfolio is where that exposure becomes visible.
What to Produce
The output that earns attention in an industrial organization is not an aggregate exposure figure. It is a small set of named consequences, each with its digital pathway, its documented cost, the controls standing between an intruder and that outcome, and an estimate of restoration time.
Presented that way the analysis is checkable by the people who run the plant, which is the test that matters, since a figure engineering cannot verify will not survive contact with an operations review. It also converts directly into board reporting without translation, because the consequences were already expressed in terms the business understood.
Use the Evidence That Exists
Industrial cyber risk resists conventional quantification because the frequency data is absent and the adversary does not behave like a random process. It becomes tractable once the direction is reversed, starting from consequences that engineering functions have already documented and working back to the digital pathways that could now reach them. The frequency term then comes from the enterprise side of the boundary, where evidence does exist. Kovrr's cyber risk quantification models industrial scenarios on that basis, keeping the estimated and documented halves distinguishable.
To see industrial consequences modeled against the pathways that could reach them, book a demo with our cyber risk experts.

OT Cyber Risk FAQs
Speak to an ExpertWhy doesn't enterprise cyber loss data work for OT?

Why is likelihood the wrong variable in industrial environments?
What does consequence-driven quantification mean here?
Do you have to model the physical consequences from scratch?
How does industrial loss differ from enterprise cyber loss?
Where do the IT and OT risk models connect?