Blog Post
Where AI TRiSM Breaks: Four Pillars, Four Units
August 30, 2026
The AI trust, risk and security management category promises a single view across four concerns. Explainability and model behavior, operational risk and drift, adversarial security, and privacy and compliance. Buy into the category and most organizations end up with three or four separate products and a dashboard that displays them beside each other.
The usual diagnosis is integration difficulty, covering proprietary log formats, custom normalization work and analysts still moving between consoles. All of that is real and none of it is the reason a single view does not appear. The obstacle is arithmetic.
Four Pillars, Four Incompatible Units
Each pillar produces output in a unit native to itself, and no operation exists that combines them.
Explainability tooling emits scores, covering bias measures, feature importance and faithfulness ratings. Model operations emits drift percentages and accuracy degradation against a baseline. Security emits findings with severity labels, and a severity label carries no price on its own. Privacy and compliance emits control status against a framework, which is closer to pass and fail than to a measurement.
There Is No Sum
A bias score of 0.12, a drift measurement of 8 percent, three high-severity findings and eleven partially implemented controls describe one AI system and cannot be added, ranked against each other or traded off. An organization asked which of the four deserves attention first has no basis for answering, and a dashboard placing all four on one screen has not helped, because putting numbers beside each other is not integration.
The Pillars Do Not Describe the Same Object
A second mismatch sits underneath the first. The four disciplines assess different things and frequently do not share an identifier for what they are looking at.
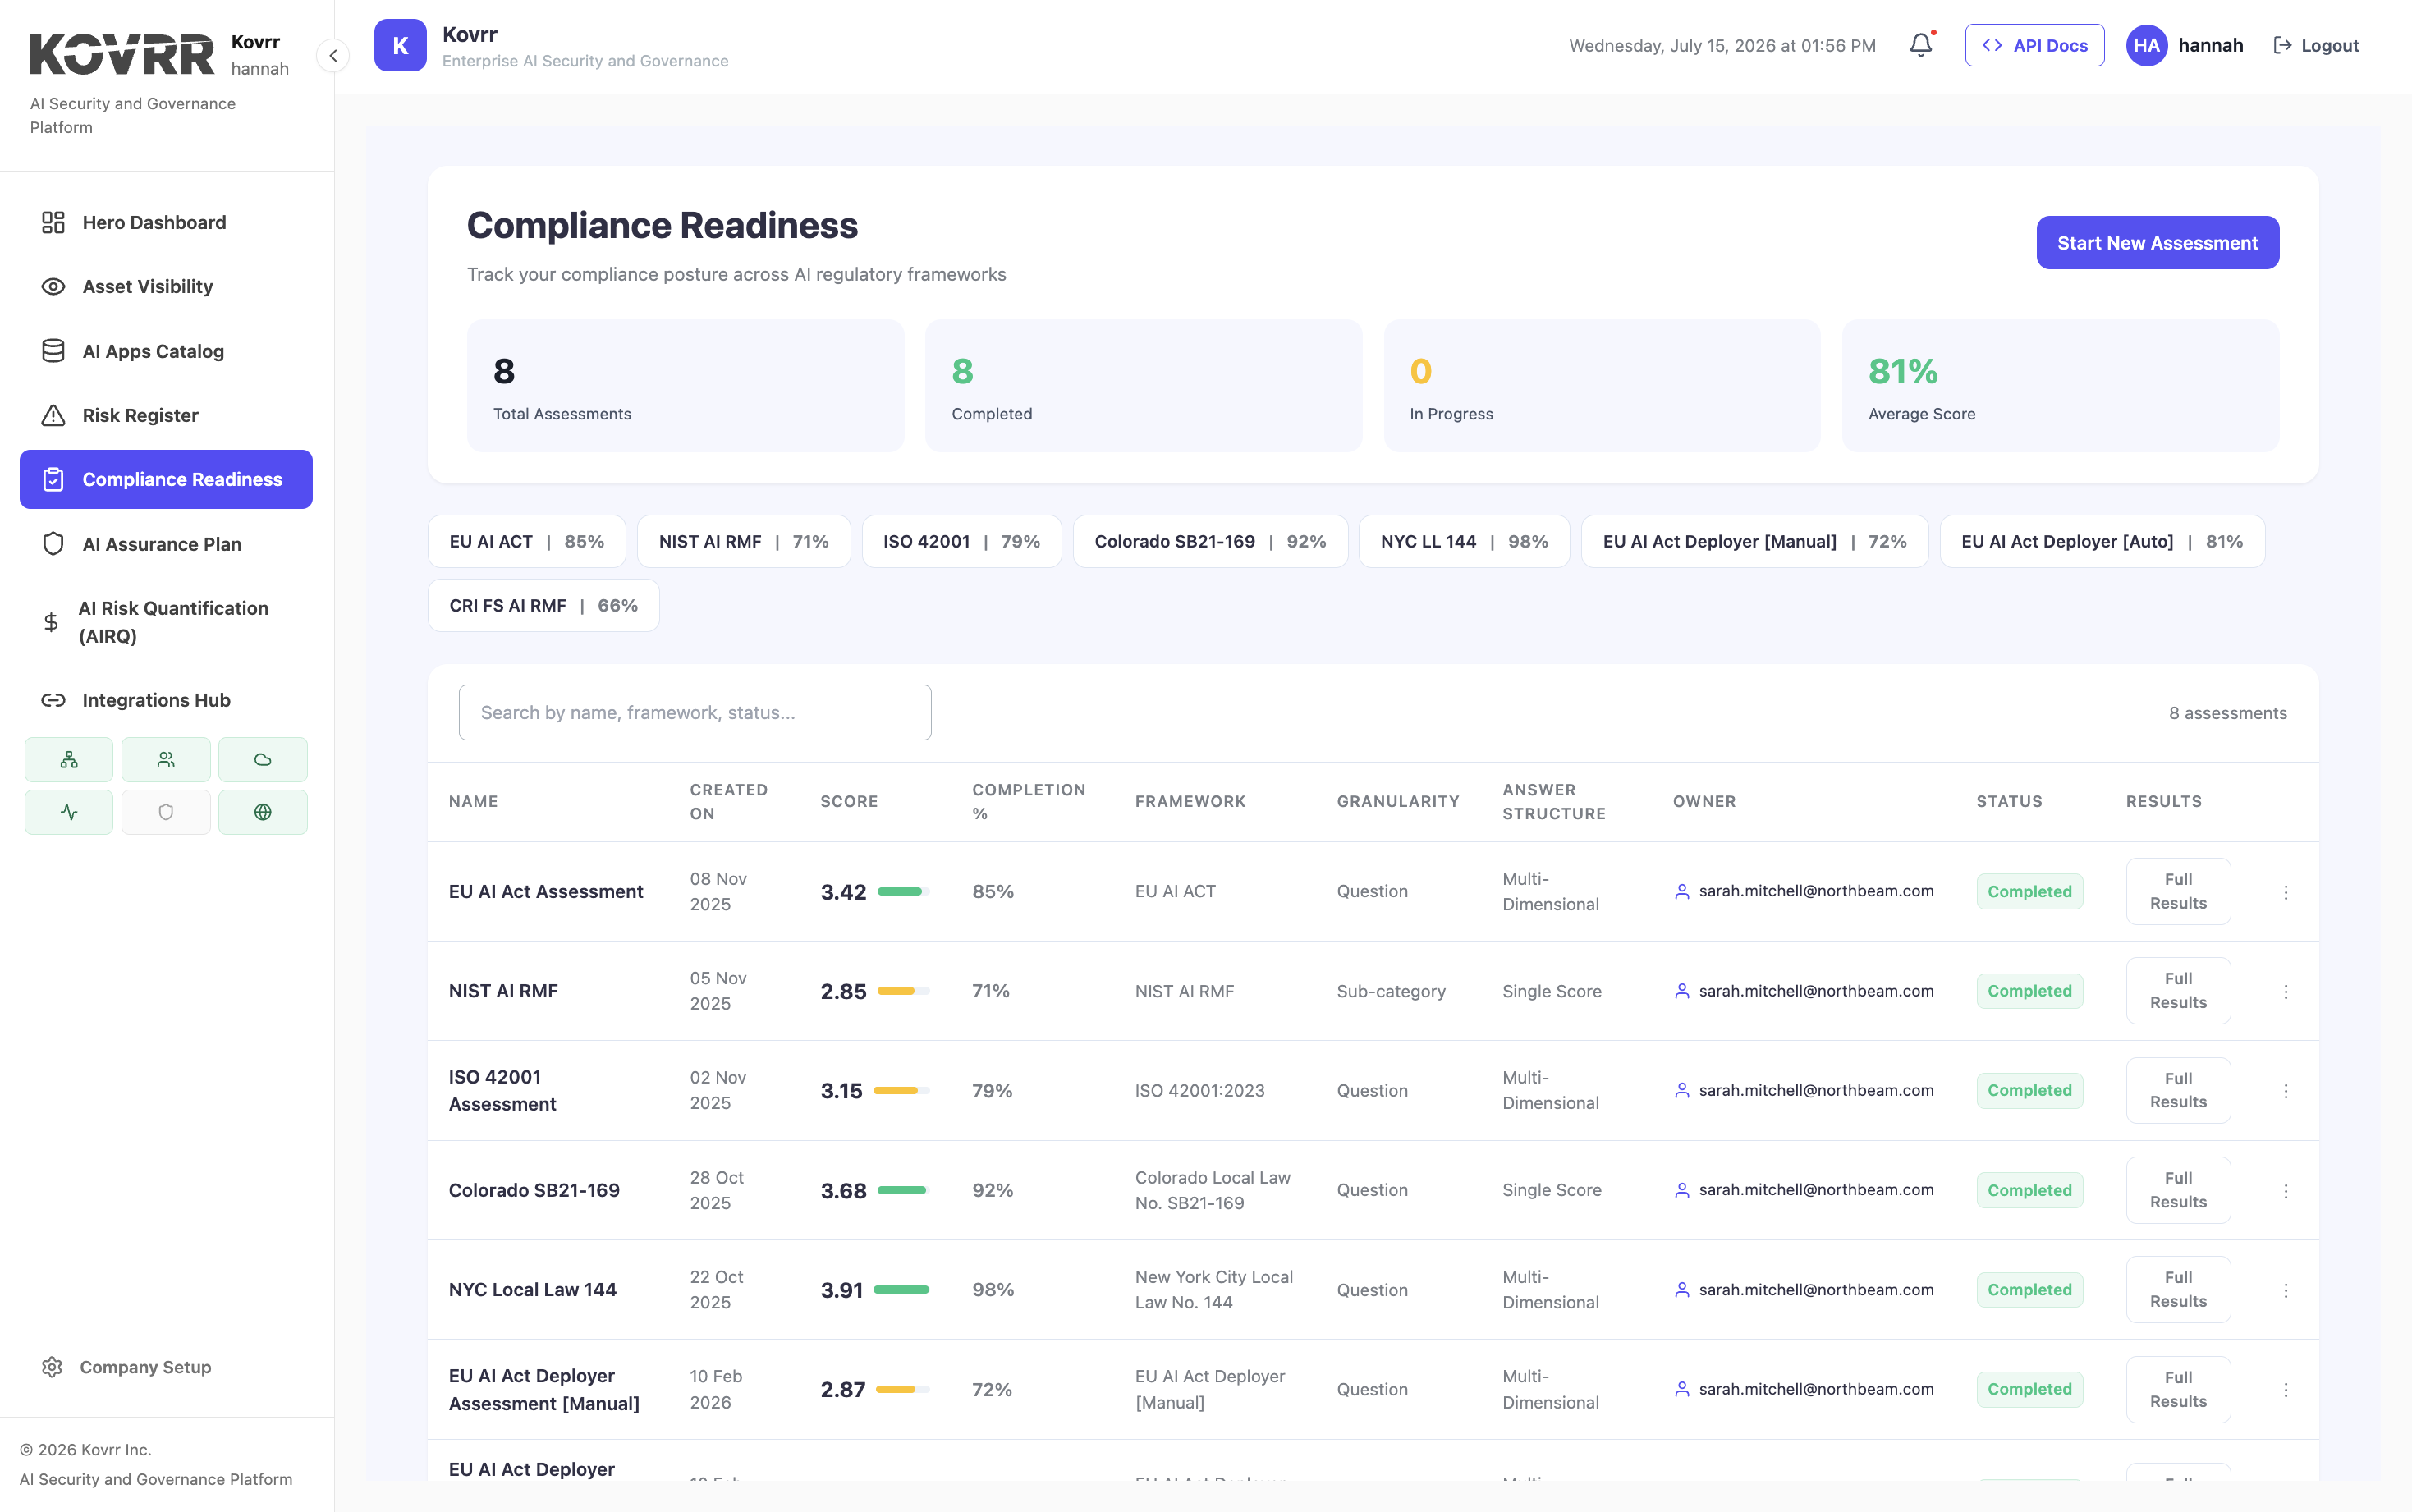
Explainability tooling assesses a model, meaning a specific set of weights. Security tooling assesses a system, meaning the pipeline, interfaces and traffic around that model. Compliance tooling assesses the organization and its use of the system for a stated purpose. Those are three different units of analysis, and deciding what counts as one asset determines whether any of them can be joined to the others at all.
Correlation Needs a Shared Key
Joining a finding to a model to a use case requires an identifier surviving across all three, and the identifier differs by vendor. Where a model registry names something one way and a security tool another, correlation becomes manual reconciliation performed by whoever assembles the monthly report, and recording the layers separately is what makes a shared key possible.
The Cadences Are Not Comparable Either
Explainability evaluation runs per release. Security monitoring runs continuously. Compliance assessment runs periodically, often quarterly or annually. Drift monitoring runs somewhere between.
A view presenting all four together shows one column reflecting the last few minutes and another reflecting a position from six months ago, with equal visual authority and no indication of which is which. Recording the assessment date against every figure is the minimum correction, and it exposes how much of a combined view describes history rather than the present. Assessments expire at different rates depending on which pillar produced them.
Currency Is the Only Common Denominator
The four outputs do share one property, which is that each describes something with a financial consequence. The shared property makes conversion possible where addition is not.
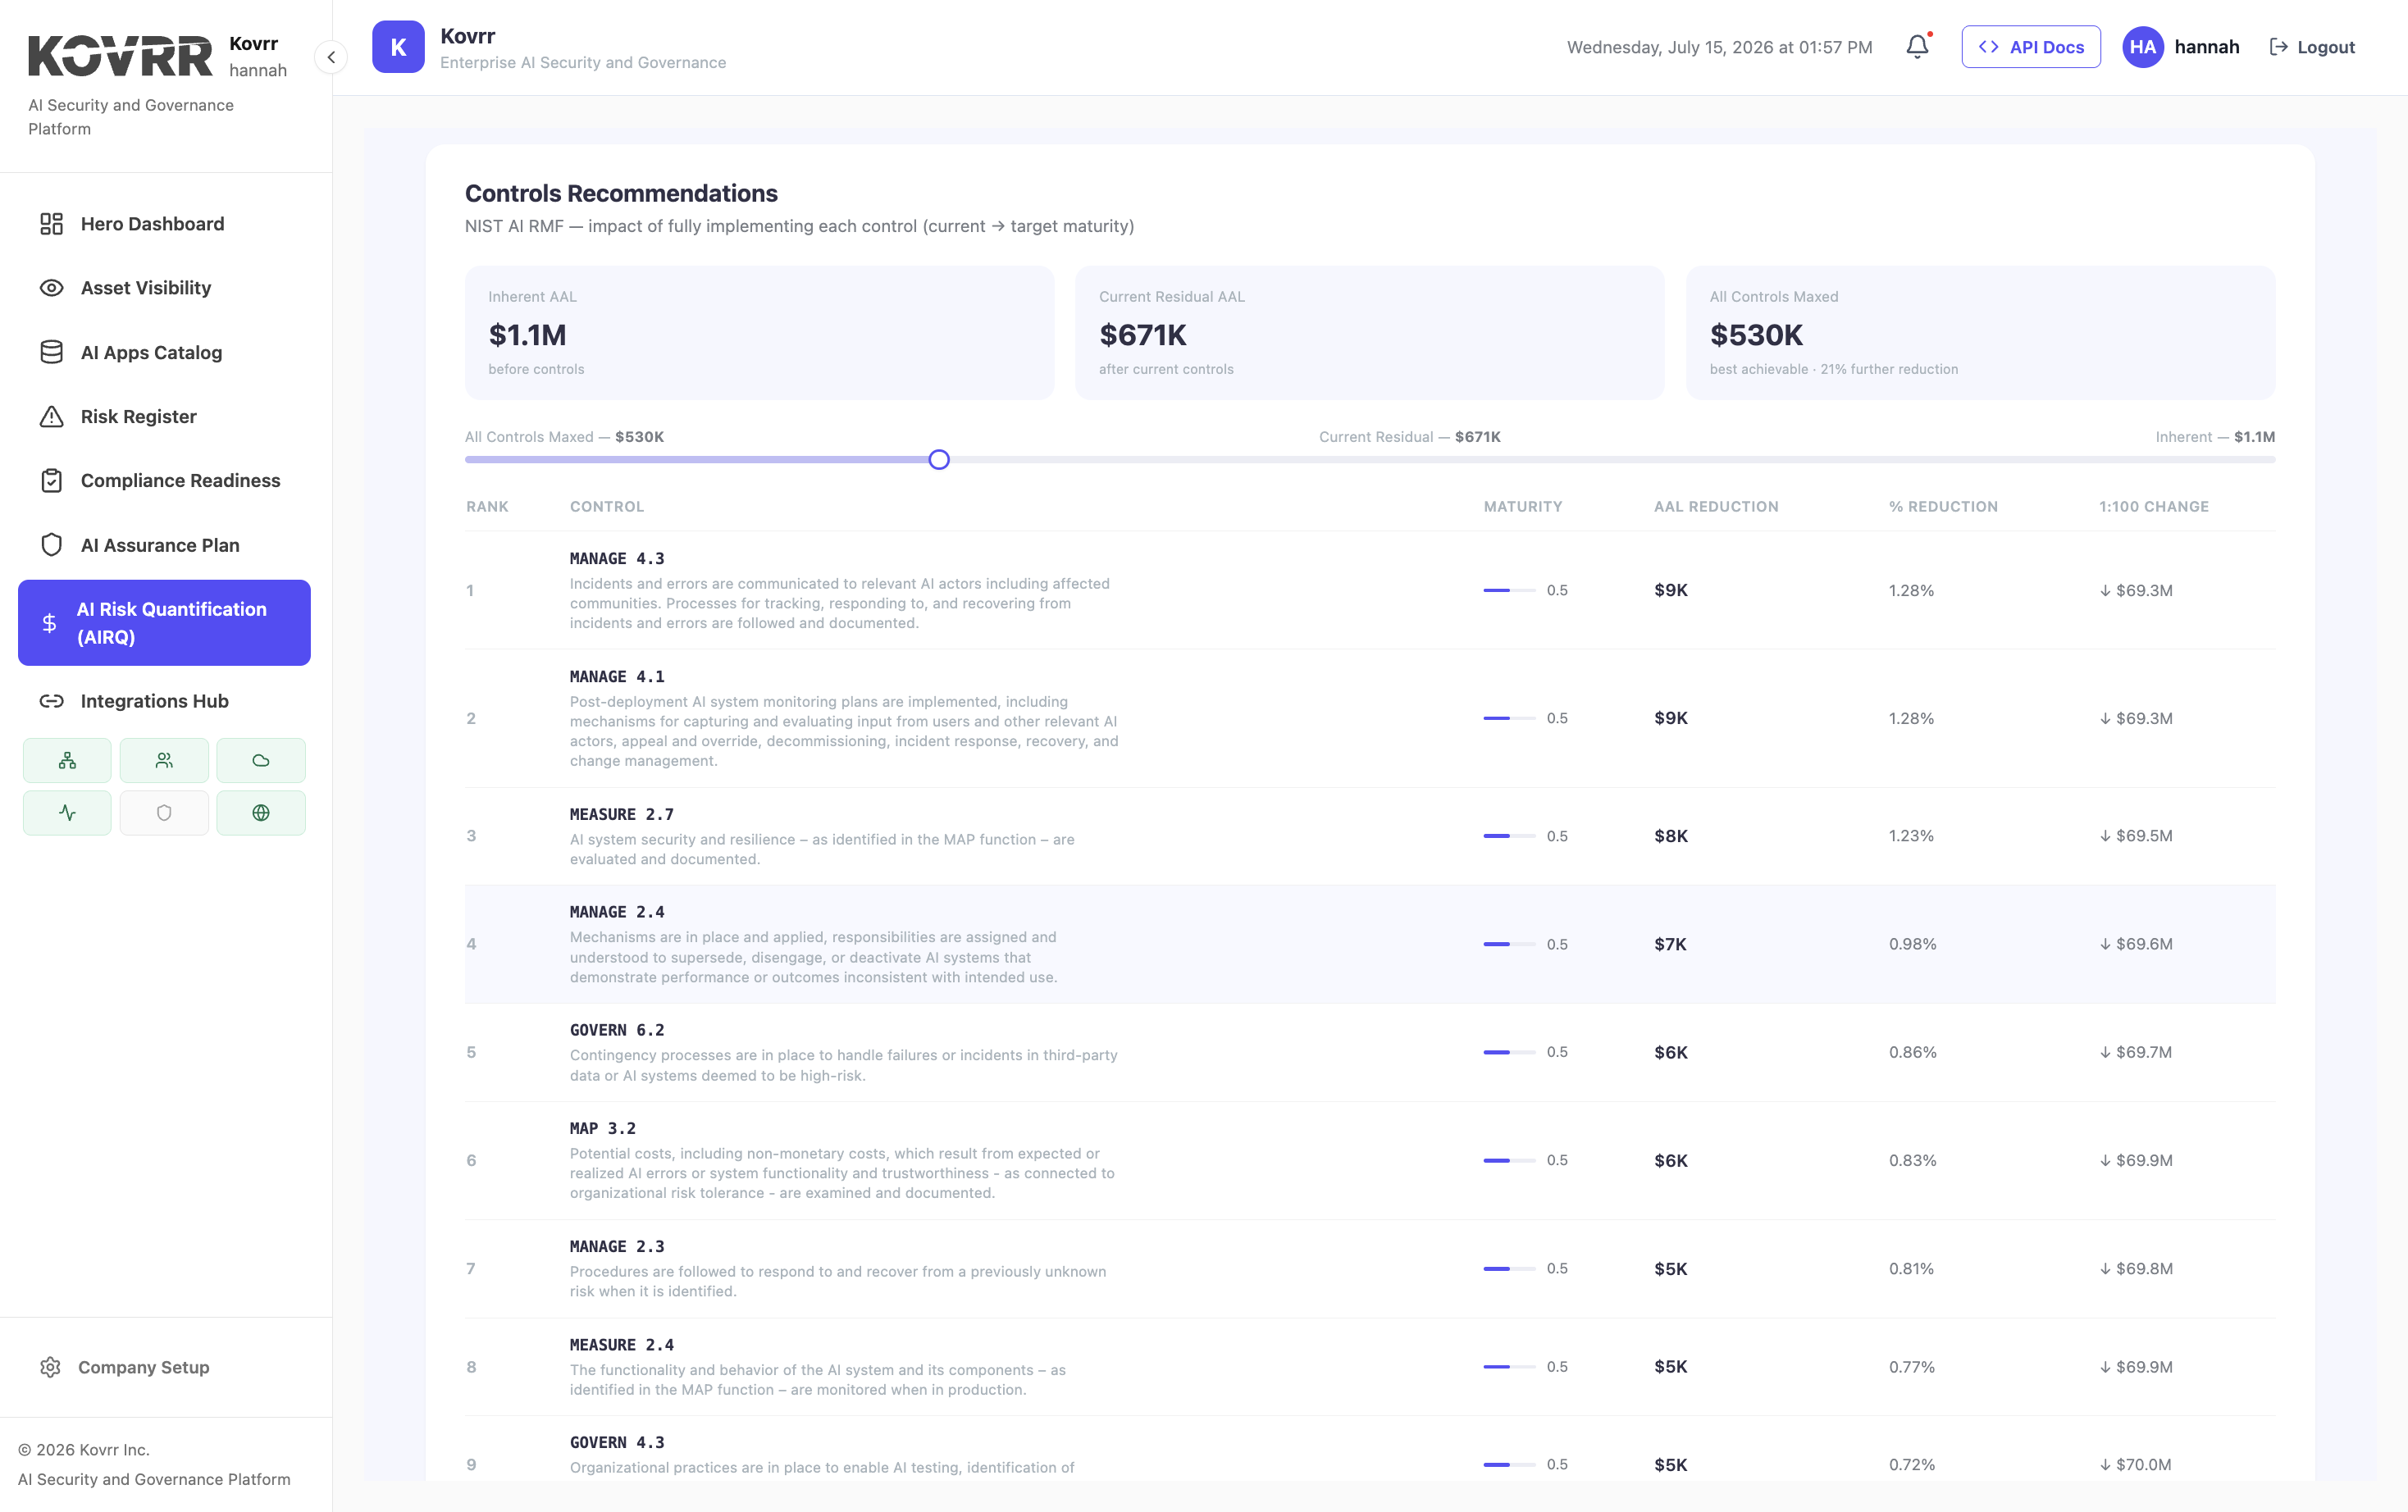
A bias finding in a lending model carries remediation cost, regulatory exposure and litigation probability. A prompt injection exposure carries a loss distribution determined by what the agent can reach. Drift in a decision model carries the cost of decisions made incorrectly during the drift window. A control shortfall against a framework carries penalty exposure and audit consequence.
Then the List Becomes One List
Once each item is expressed as expected loss, ranking across pillars is arithmetic rather than judgment. The bias finding either carries more exposure than the injection risk or it does not, and the answer determines sequence. The conversion is the point at which a single view stops being four panels and becomes a decision, and AI risk quantification is what performs the conversion.
It Also Makes the Category Comparable Outward
A secondary effect matters for anyone presenting upward. Expressed in currency, AI exposure sits alongside cyber, credit and operational risk in the same format a board already reads, which removes the translation burden that scores and severity labels place on directors.
Where Currency Is the Wrong Unit
The argument has limits and stating them is what keeps it honest.
- Prohibitions Are Binary: A practice that is prohibited stays prohibited regardless of what a model says the exposure is.
- Some Harms Resist Monetization: Effects on individual rights, safety and dignity should not be reduced to an expected cost, and regulators do not treat them that way.
- Frequency Is Sometimes Unobservable: Certain exposures have no base rate, so the conversion produces a range rather than a figure.
The third of those is worth handling explicitly rather than hiding. Where frequency cannot be estimated, pricing recoverability instead of probability gives a defensible number, which is the approach pricing model provenance takes for the same reason. A model producing confident figures for exposures nobody has observed is the failure mode a serious risk function watches for in its own output.
What to Ask a Vendor Claiming Integration
Four questions separate a joined platform from a shared dashboard, and none requires a technical evaluation.
Ask what identifier links a security finding to a specific model and to a specific business use, and whether the platform assigns it or expects you to. Ask what unit the combined view reports in, and whether items from different pillars can be ranked against each other in a single list. Ask what the assessment date is for each figure on the screen, and whether stale figures are visually distinguished from live ones. Then ask to see a ranking that mixes pillars, since that is the output the category promises and the one most difficult to fake.
Coverage Questions Come Second
Which pillars a product covers matters less than whether its outputs compose. A platform covering three pillars in one unit is more useful than one covering four in four units, because the second leaves the aggregation work with the customer, and sorting the market by what each tool was built to do is where that distinction shows up.
Integration Is a Units Problem
The category describes a real need and the products in it mostly do their individual jobs. What fails is the promise of one view, and it fails because explainability scores, drift percentages, security severities and control statuses have no arithmetic between them, describe different objects, and are refreshed on incompatible cycles. Converting each into expected loss is the only route to a list somebody can act on, with prohibitions and rights-based harms handled separately because they are not trade-offs. Kovrr's AI Security and Governance Platform reports across those concerns in one unit, which is what makes the combined view a decision rather than a display.
To see findings from across your AI estate ranked in one list rather than four panels, book a demo mapped to your own environment.

AI TRiSM FAQs
Speak to an ExpertWhat does the AI trust, risk and security management category cover?

Why does integrating these tools fail?
Do the pillars assess the same thing?
How does expressing everything in currency help?
When is a financial figure the wrong unit?
What should you ask a vendor claiming an integrated view?