
Blog Post
How to Translate Cyber Risk Into Financial Terms the CFO Understands
July 12, 2026
Cyber risk assessed on a red-yellow-green heatmap will never survive a serious CFO conversation. Boards and finance leaders make decisions in dollars, using probability distributions and expected-value calculations. When cybersecurity walks in with a qualitative rating and a request for more budget, it is speaking a different language than the room. A modern cyber risk register built on quantified exposure fixes that at the source. It converts the same underlying threat data into a probable annual loss and a tail exposure at the 1-in-100 threshold, alongside a loss curve the finance team can reason about the same way it reasons about market risk or credit risk.
Quick answer. Financially assessing cyber risk exposure means producing three numbers a CFO recognizes:
- Average Annual Loss (AAL): The expected dollar loss across all simulated scenarios in the next year
- 1:100 Annual Loss: The loss value with a 1 percent annual probability of being exceeded, used for tail-risk and insurance conversations
- Loss Exceedance Curve: The full probability distribution of potential annual losses, shown as a curve from likely outcome to worst-case tail
Getting there requires moving from qualitative to quantitative risk assessment, credible data inputs, and a documented connection between the technical controls the security team operates and the financial exposure the business carries.
Why Qualitative Risk Ratings Fail at the CFO's Desk
A "high" rating on a cyber risk register tells the CFO nothing actionable. It does not say how much money is at stake, how likely the loss is, or whether spending an additional $500,000 on a control would reduce that exposure by $50,000 or by $5 million. The rating collapses probability and impact into a single color, then throws away the information the finance function needs to allocate capital.
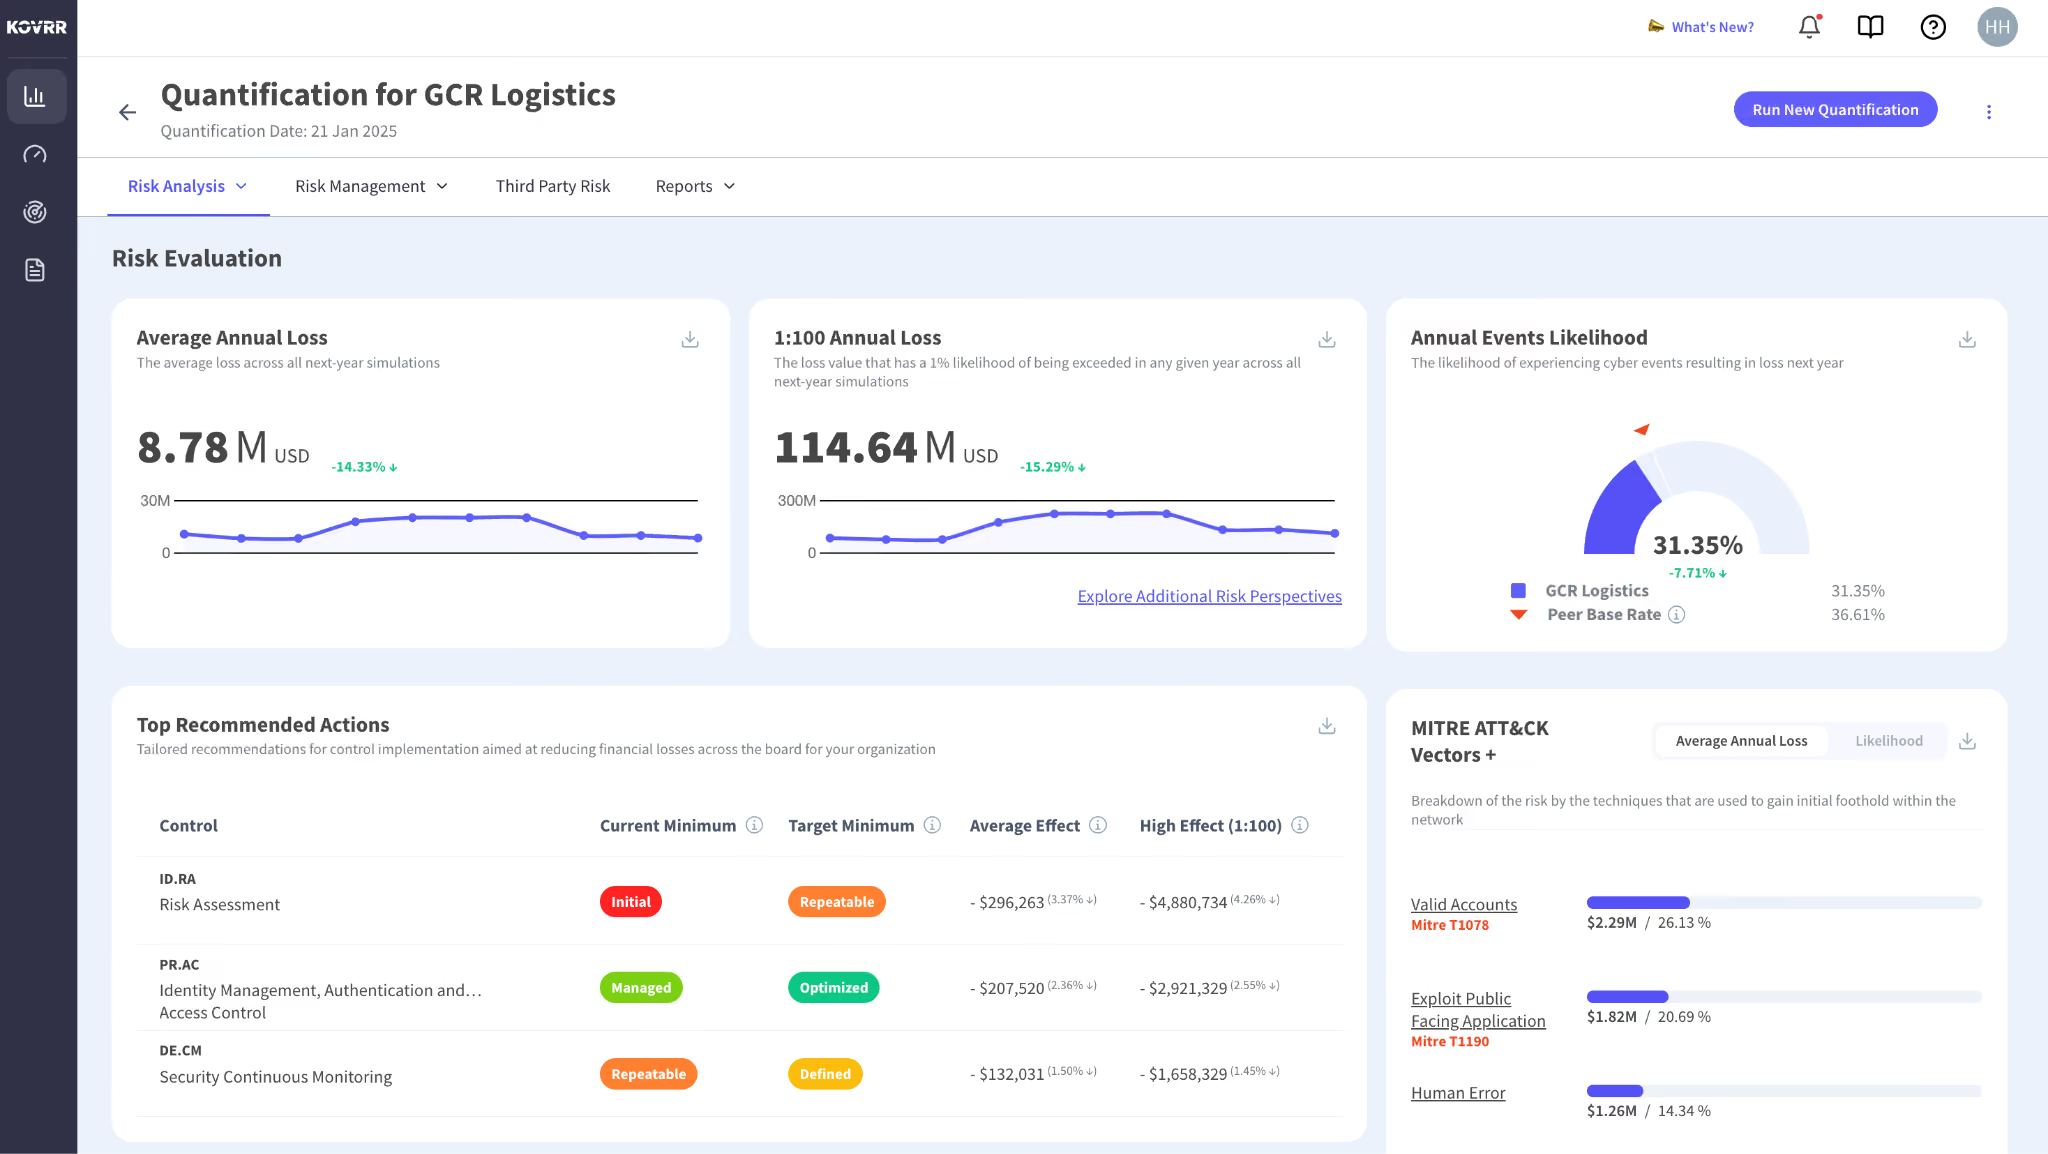
Boards recognize the pattern. Cyber is presented in stoplight colors while every other enterprise risk category comes with a dollar figure and a confidence interval. What CFOs get from a heatmap versus a quantified model:
- Heatmap output. A red, yellow, or green tile. No probability. No dollar range. No comparability with other risk categories.
- Quantified output. A distribution of possible losses in dollars, with annual probabilities attached, comparable to any other line on the enterprise risk register.
Modernizing the risk register from spreadsheets to a quantified platform restores the missing structure by producing outputs the CFO already knows how to read.
What Financial Cyber Risk Quantification Measures
A defensible quantification produces three headline numbers that anchor every board conversation.
Average Annual Loss (AAL). The expected loss across all simulated scenarios over the next year. This is the number the CFO uses for reserving, for expected-value calculations, and for comparing cyber against other enterprise risks. A cyber risk quantification program that cannot produce a stable AAL is not a program yet.
1:100 Annual Loss. The loss value that has a 1 percent chance of being exceeded in any given year. This is tail exposure, the number that matters for cyber insurance coverage optimization, for stress testing, and for board-level risk appetite conversations. It answers the question of what a bad year looks like.
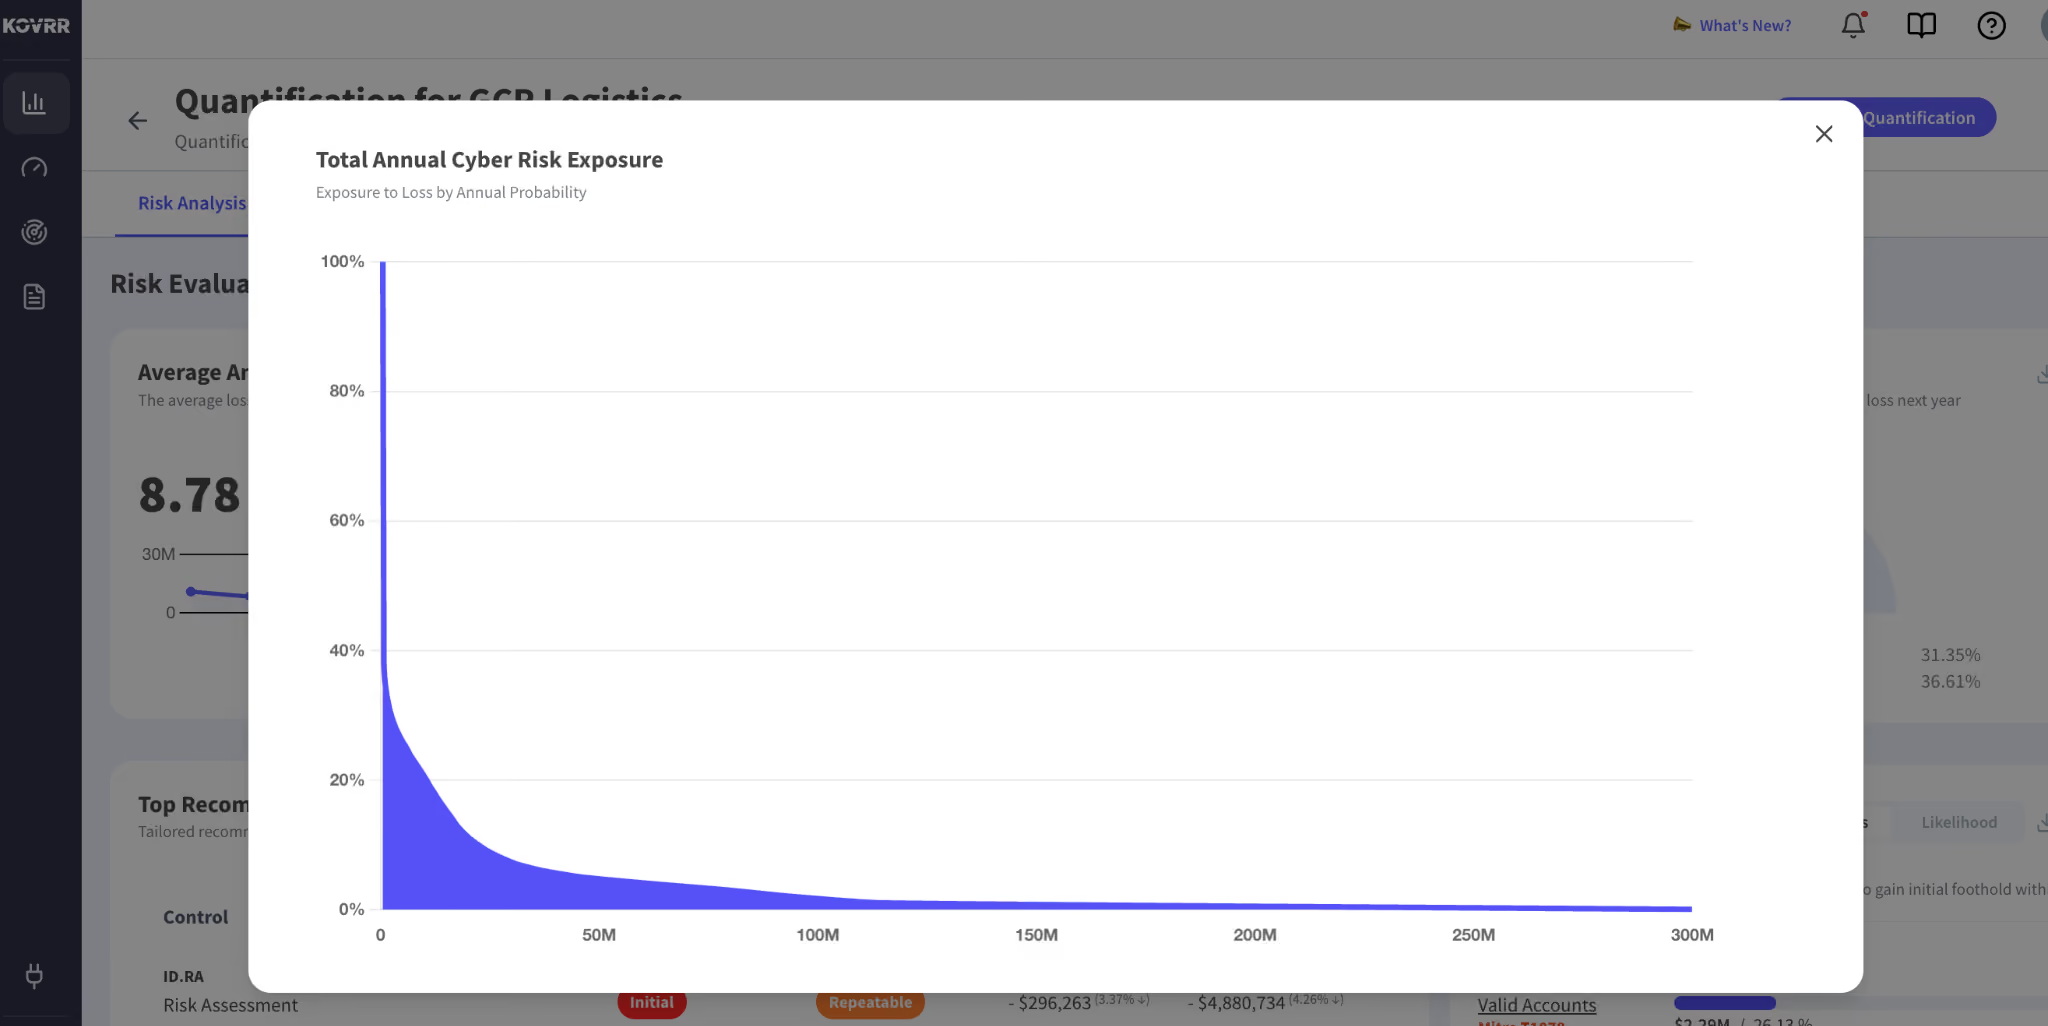
Loss Exceedance Curve. The full probability distribution of potential annual losses, plotted as a curve from most likely outcome to worst-case tail. The Loss Exceedance Curve lets the CFO see, at any dollar threshold, the annual probability of exceeding it. It is the same shape a chief risk officer uses for market and credit exposures, which makes cyber legible to the rest of the enterprise risk function.
How to Build the Financial Model
Financial quantification stands or falls on the inputs. Four steps get the model to a credible starting point.
1. Inventory the Assets Tied to Revenue
Catalog data assets, systems, and processes across cloud, on-premises, and operational technology environments. Trace which internal systems feed revenue generation directly. A customer-facing e-commerce platform carries different exposure than an internal HR portal, and the quantification model needs to know which is which before it can weight losses appropriately.
2. Assign Business Value, Not IT Value
Replacement cost is what an accountant uses. Revenue impact is what a CFO uses. Assign each critical asset a business value tied to what happens when it is unavailable, breached, or manipulated. Security and finance need to build this part of the model together, because the numbers only hold up if the business side signs off on the underlying valuations.
3. Model Event Frequencies From Real Data
Frequency inputs pulled from generic industry averages produce generic outputs. Stronger inputs come from:
- Historical incident data across comparable organizations
- Insurance claims data from carriers writing the cyber line
- Industry-specific benchmarks calibrated to sector, size, and control posture
- The organization's own control maturity mapped to a recognized framework
Frequencies vary dramatically by sector, size, and posture, and the model needs those variables reflected in the inputs.
4. Simulate Loss Distributions
Run thousands of Monte Carlo simulations over the modeled scenarios. Kovrr's CRQ engine runs 25,000 trials per quantification, producing a statistically significant loss distribution rather than a point estimate. The output is a range with a probability weighting attached to every point in that range, which is what makes the model useful for financial decisions rather than approximate storytelling. Beyond baseline modeling, scenario intelligence lets teams stress-test specific event types, and top-down scenarios test enterprise-wide crises.
The Four Financial Impact Categories to Model
Every cyber event produces losses across four buckets. A quantification that only counts one or two of them will understate exposure and lose credibility with the CFO the first time an actual incident breaches its bounds.
- Primary direct losses. Ransomware payments, forensic incident response fees, hardware replacement, and immediate remediation costs. These are the numbers that show up in the first week.
- Business interruption. Lost revenue during downtime, idle employee productivity, delayed shipments, and supply chain disruption. For most organizations, this exceeds direct losses within days.
- Legal and regulatory exposure. Class-action lawsuits, regulatory fines, GDPR penalties, SEC cybersecurity disclosure actions, and legal defense costs. These lag the initial event but compound quickly, especially for regulated industries running materiality analysis against loss thresholds.
- Secondary consequences. Brand reputation damage, customer churn, higher insurance premiums at the next renewal, and lost future revenue from deals that quietly go elsewhere. Hardest to quantify, most often ignored, and often the largest number in the total.
How the Financial Numbers Get Used
A financial cyber risk assessment earns its return the moment it starts driving decisions. Four use cases carry most of the value.
- Board reporting. Replace the stoplight chart with a distribution. Cybersecurity board reporting built directly from platform data lets security leaders present a defensible number rather than an educated guess, and there is a growing playbook of board-level metrics worth adopting.
- Budget justification. Every proposed control investment gets a dollar-for-dollar risk reduction estimate. Budget justification and prioritization move the conversation from "why do we need this" to "which reduces exposure most per dollar."
- Insurance optimization. Match coverage limits to the actual tail exposure the model produces. Buy layers that cover the space between corporate risk appetite and modeled tail losses, and negotiate premiums using the quantified control maturity data underwriters already recognize.
- Third-party and portfolio views. Rank vendors, business units, or portfolio companies by financial cyber exposure. Third-party risk quantification and portfolio risk management let boards of holding companies and PE firms prioritize where cyber investment moves the needle across a portfolio.
Where CFOs Push Back and How to Answer
Two objections come up in every serious CFO conversation, and the model has to answer both.
1. "Where do the numbers actually come from?" The right answer names the data sources:
- Historical incident data across comparable organizations
- Insurance claims history
- Industry benchmarks calibrated to sector and size
- The organization's own control maturity mapped to NIST CSF or an equivalent framework
When the CFO sees the model is anchored to real losses at comparable organizations rather than expert opinion, the pushback drops.
2. "How do we know this is not a number you can move to justify the budget you already wanted?" The answer is model transparency:
- Publish the assumptions
- Publish the frequency inputs
- Publish the loss magnitude inputs
- Publish the control effect calculations
- Show the model produces different numbers when inputs change and reproducible numbers when they do not
Reproducibility earns credibility, and enhancing enterprise risk management with CRQ is how the discipline crosses over into the broader ERM conversation.
Moving Cyber Into the Financial Conversation
Cybersecurity that speaks in dollars gets treated as an enterprise risk category rather than an IT expense. Financial quantification is the bridge, and once the CFO has an AAL and a loss curve to work with, the entire conversation changes. Budget allocations become optimization problems. Insurance decisions become math the finance team already understands.
Board reporting becomes benchmarkable against every other risk category on the enterprise risk register. The technical work of protecting the organization does not change. The way it gets funded and defended in the boardroom does.
Book a demo of Kovrr’s CRQ platform to see how the model produces AAL, tail exposure, and a live loss curve tuned to your environment.

Translating Cyber Risk for the CFO FAQs
Speak to an ExpertHow is Average Annual Loss (AAL) calculated?

What is the difference between AAL and 1:100 annual loss?
Do I need a full asset inventory before I can quantify cyber risk?
How does financial quantification compare to a heatmap or 5x5 risk matrix?
Can financial cyber risk quantification tie directly to cyber insurance decisions?
How often should a financial cyber risk quantification be refreshed?