
Blog Post
Which Modeling Lens Decides What Gets Funded
August 31, 2026
Two lenses are available for quantifying cyber risk. One models named scenarios in detail. The other models the organization as a whole and reports an annual position. Most of the discussion treats this as a methodological preference.
It is a budget decision. The lens determines which controls acquire a financial justification, and each lens has a systematic blind spot that funds the wrong thing in a predictable direction.
What Does Each Lens Fund?
Different categories of control, and the pattern is consistent enough to predict from a program's approach alone.
Scenario-led analysis funds controls attached to the scenario driving the largest figure. Ransomware as the top scenario produces investment in segmentation, backup immutability, detection on the systems that scenario names and recovery capability for those systems specifically. Each item has a clean return calculation, because the loss it reduces belongs to an identified event.
Enterprise-wide analysis funds capability that moves the aggregate. Identity and access management, logging coverage, asset inventory, patch performance across the estate. Each of those appears in many scenarios and dominates none, so the justification comes from the total rather than from any single event.
What Does Scenario-Led Analysis Systematically Underfund?
Cross-cutting controls, and the mechanism is structural rather than a failure of judgment. A control appearing in eight scenarios and dominating none of them never becomes the top recommendation in any individual analysis.
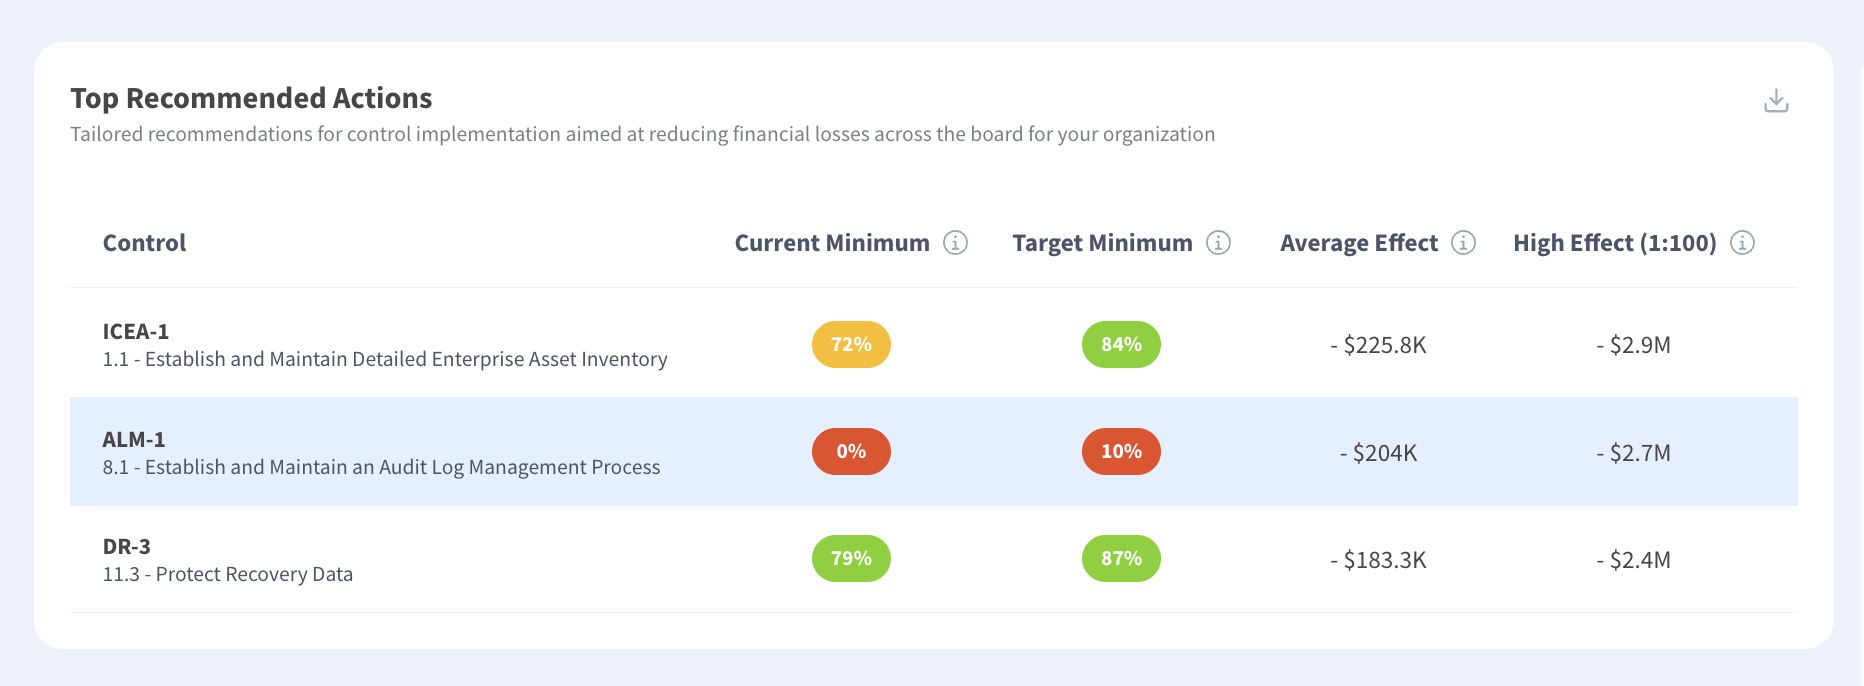
Identity is the plainest example. Credential abuse is a step in a great many scenarios and the headline of very few, so a program working scenario by scenario finds identity investment ranked third or fourth every time and funded never. The same applies to logging coverage, which reduces detection time across every scenario while owning none of them.
How Does That Show Up in a Budget?
As a portfolio of point solutions with a weak foundation underneath. Programs in this position have strong controls around the systems named in their top three scenarios and inconsistent basics everywhere else, which is a recognizable shape and one an assessor spots quickly.
What Does Enterprise-Wide Analysis Underfund?
Defenses against specific severe events, because an aggregate figure absorbs them. A scenario with a low probability and a catastrophic consequence contributes modestly to expected annual loss while dominating the extreme tail, and a program reporting the aggregate alone sees a small number.
Operational technology exposure is the common case. A plant-level event is rare enough to barely move the average and severe enough to threaten the organization, so it justifies dedicated investment that an aggregate view will not surface. Quantifying industrial exposure requires modeling the consequence directly for exactly that reason.
Which Number Hides It?
Expected annual loss, almost always. Reading the aggregate at the average conceals any exposure whose weight sits in the tail, and the same distribution read at a return period reveals it. A program reporting only one of those two figures has chosen which blind spot to accept, usually without noticing the choice.
How Do You Tell Which Lens Your Program Uses?
Look at what the last three approved investments were, rather than at what the methodology document claims.
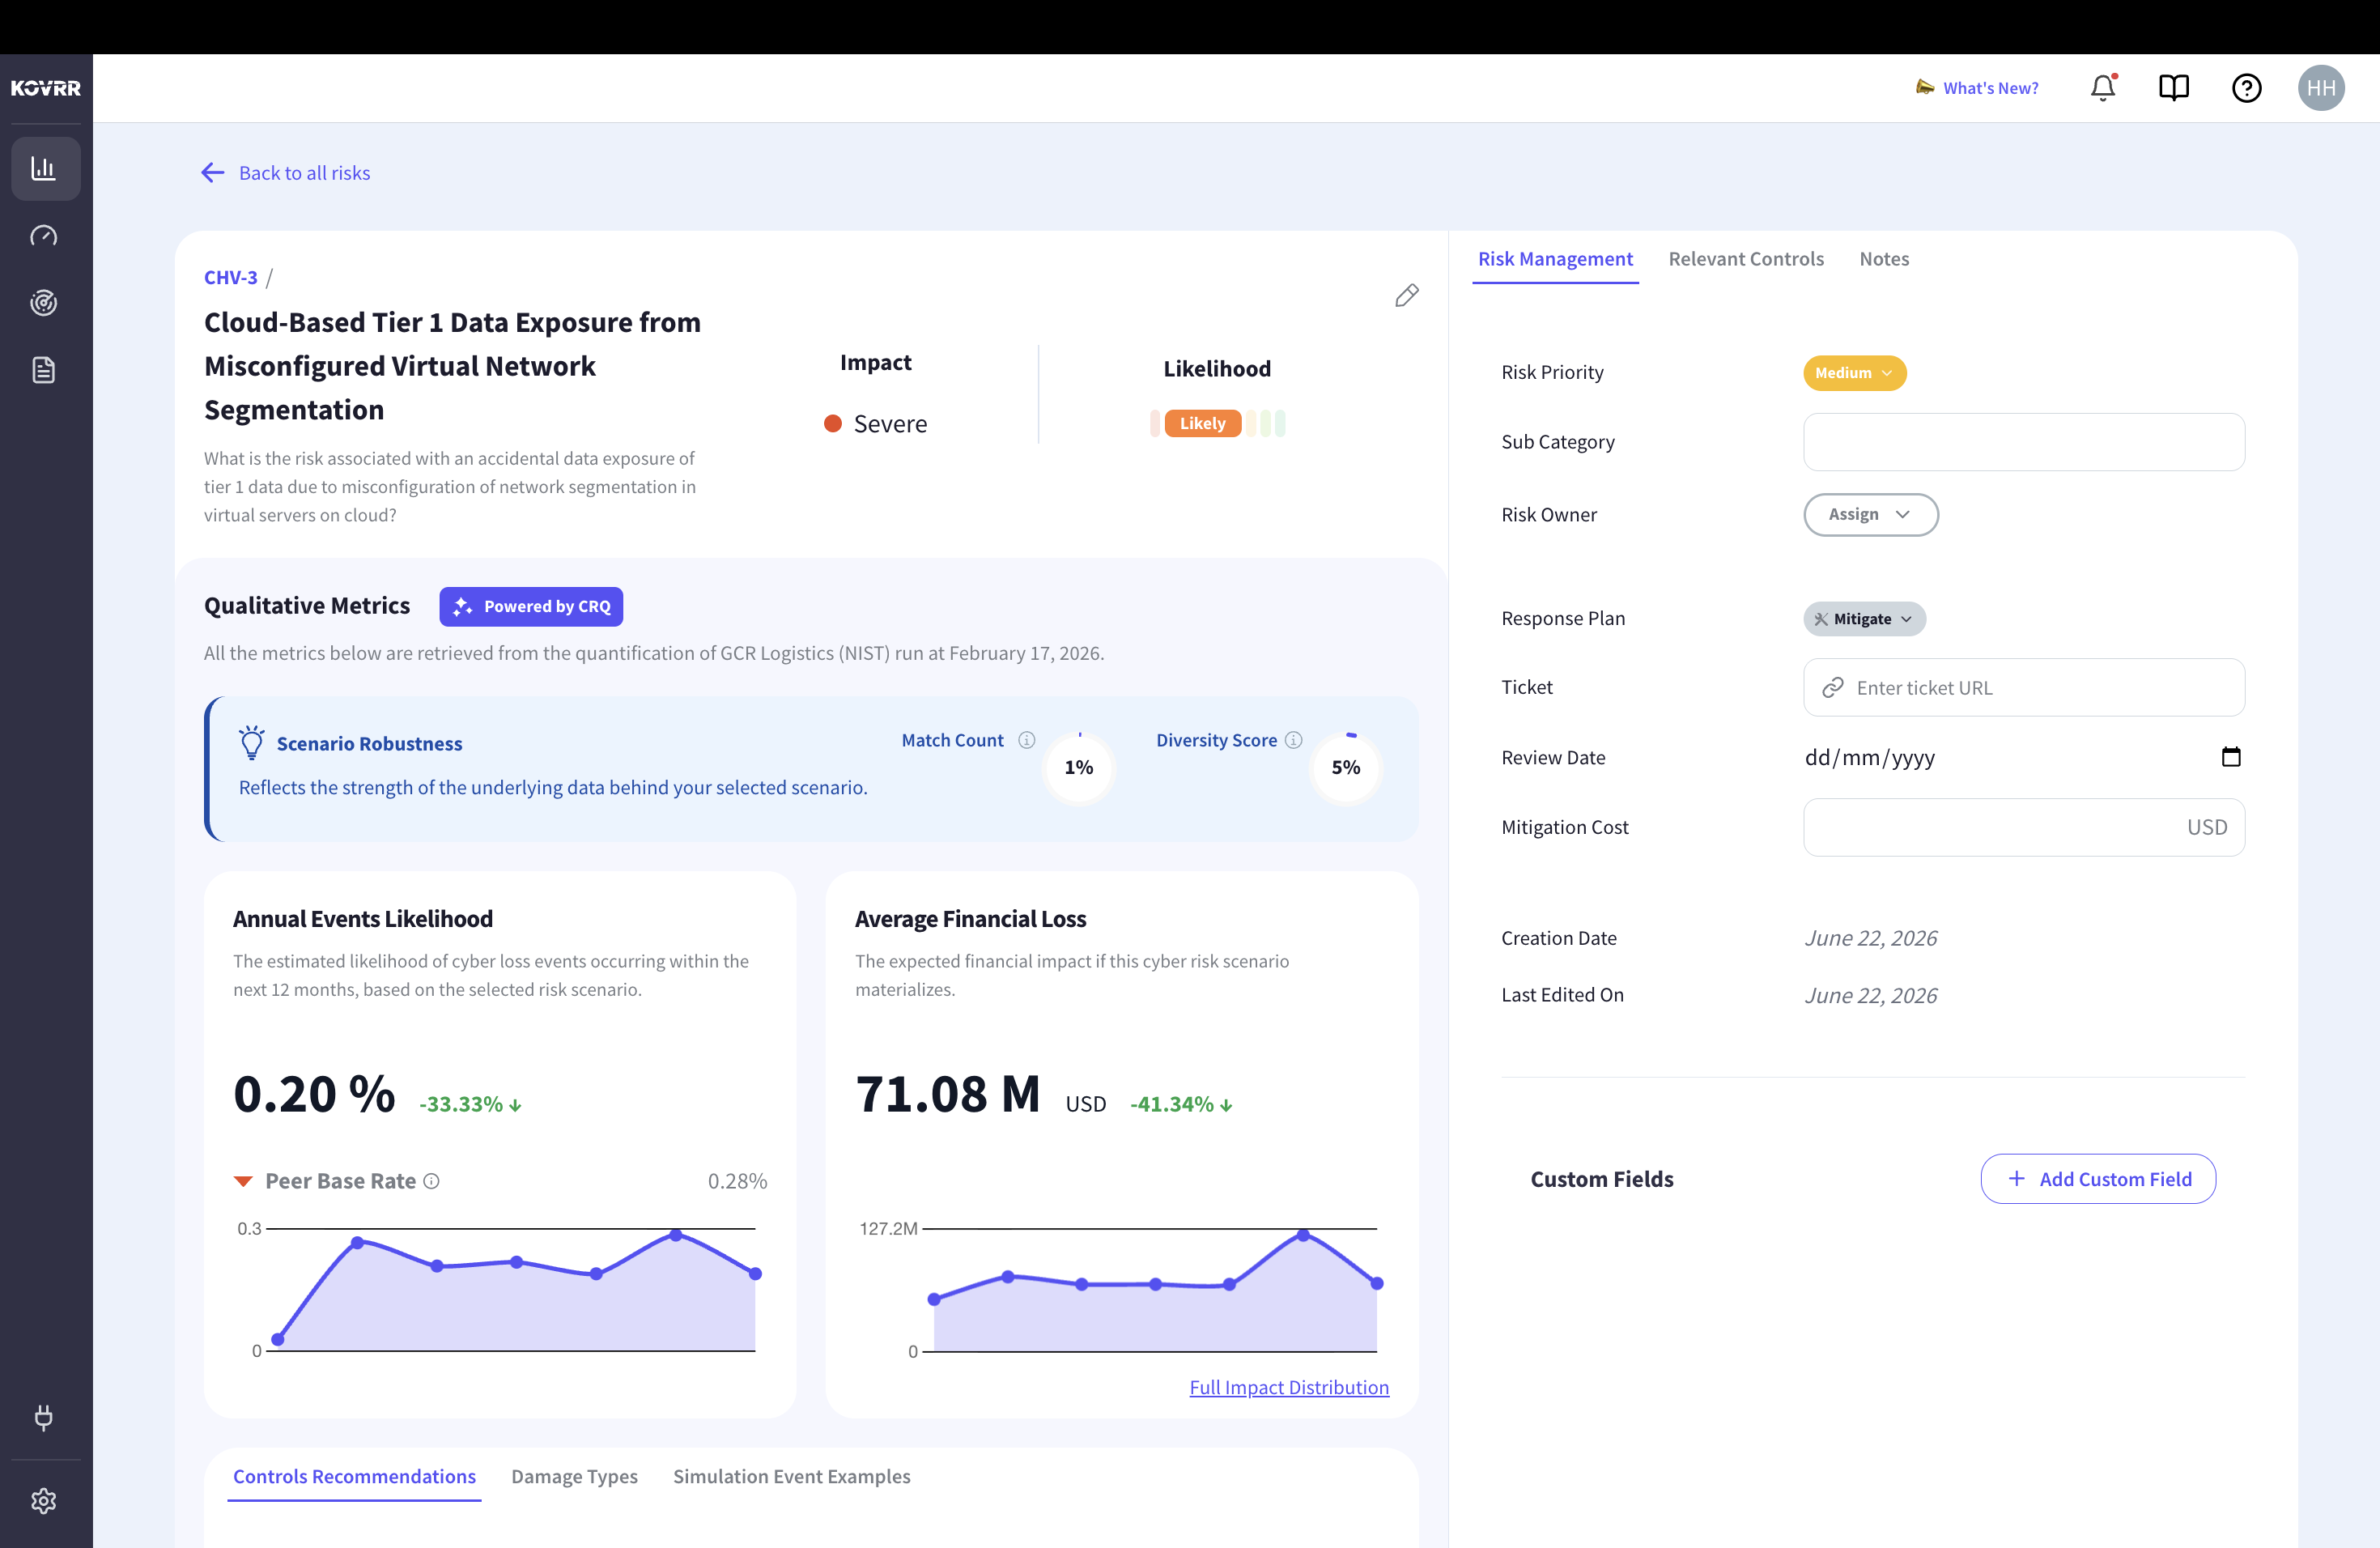
Three named-threat controls means scenario-led, whatever the program calls itself. Three infrastructure or platform investments means aggregate-led. A mix suggests either genuine balance or that funding decisions are being made outside the model entirely, and distinguishing those two is worth an afternoon.
Why Does the Lens Get Chosen by Accident?
Because it usually follows from who asked. A chief financial officer asking what ransomware would cost gets a scenario. A board asking whether exposure is within appetite gets an aggregate. Programs drift toward whichever question arrives most often, and the resulting bias in the control portfolio is a consequence of the questioning pattern rather than of a deliberate decision.
How Do You Get Both Without Running Two Programs?
Attribute exposure reduction to controls rather than to scenarios. The scenarios remain the modeling unit and the reporting unit becomes the control.
A control appearing in eight scenarios receives credit for the reduction it produces in all eight, summed. The change surfaces identity, logging and inventory investment inside a scenario-led program without abandoning scenario modeling, because the arithmetic now reflects that the control operates everywhere. It also produces a ranked list that a security team can work through in order, which risk-focused prioritization depends on.
What Does That Require From the Model?
A mapping from controls to scenarios, which most programs have implicitly and few have recorded. Each scenario needs its dependent controls named, so the reverse lookup is available. The exercise is mechanical rather than analytical, and it is the same mapping that lets a control failure be traced forward into the scenarios it exposes.
Does This Fix the Tail Problem Too?
Partly, and only if the reduction is reported at both the average and a return period. A control reducing expected annual loss substantially while barely affecting the extreme figure is doing different work from one that flattens the tail, and reporting only the first ranks them identically. Both columns belong in the output.
Does the Choice Change What Counts as Success?
Substantially, and this is where the two lenses diverge most awkwardly for anyone reporting progress.
A scenario-led program demonstrates success by showing a named scenario's figure falling after an investment. The claim is specific and the attribution is clean, and it says nothing about whether total exposure moved, since narrowing one path can leave the aggregate untouched where the underlying weakness reappears elsewhere. An aggregate-led program demonstrates success by showing the total falling, which is the claim a board wants and offers no evidence about which investment produced it.
Can an Investment Reduce a Scenario and Not the Total?
Routinely, and it is the most common way a program overstates its own effect. Segmenting the systems in the top scenario reduces that scenario's figure while the attacker's path moves to an adjacent system modeled under a different entry, so the aggregate barely moves. Reporting the scenario improvement without the aggregate presents a real change as a larger one than it was, and measuring the right indicator is what separates the two.
What Does Honest Reporting Look Like?
Both figures, with the scenario improvement stated as the direct effect and the aggregate movement as the net one. Where they agree, the investment did what was claimed. Where the scenario fell and the total held, the exposure moved rather than reduced, which is a finding worth surfacing rather than omitting.
Which Lens Suits Which Audience?
Both, for different conversations, and using the wrong one is a communication failure rather than an analytical one.
Scenarios persuade in the room. A named event with a mechanism, a figure and a control that reduces it is an argument a non-technical audience can follow and challenge. Aggregates persuade over time, because a figure that can be compared against the previous quarter and against a threshold produces a series rather than a story. Executives asking for a decision want the first and directors monitoring a position want the second, and quantified board reporting needs the aggregate while the budget conversation needs the scenario.
What Happens If You Only Have One?
Scenario-only programs win individual funding rounds and cannot demonstrate that the position improved, because there is no comparable total. Aggregate-only programs can show a trend and struggle to justify any specific purchase, since the aggregate never says which control to buy. Both failures are recognizable and both are solved by the attribution step rather than by a second modeling exercise.
Where Does Each Lens Come From?
The two approaches carry the assumptions of the disciplines that produced them, which explains why they emphasize different things.
Scenario analysis descends from operational risk and safety engineering, where the unit of concern is a specific failure with a mechanism that can be traced and interrupted. The heritage is why it produces strong causal arguments and struggles with totals. Aggregate loss modeling descends from insurance and capital management, where the unit of concern is a portfolio position over a defined period. The same heritage is why it produces comparable series and cannot recommend a purchase.
Is One More Rigorous Than the Other?
Neither, and the argument that one is tends to reflect professional background rather than evidence. Both require frequency and severity estimates, both express results as distributions, and both are limited by the same input quality. A program treating its preferred lens as the rigorous one and the other as approximate has confused familiarity with validity, which comparing quantification methodologies examines in more detail.
What Should You Do With This?
Three steps, and the first is diagnostic rather than corrective.
Categorize the last several funded investments as scenario-driven or infrastructure, which reveals the operating bias. Record the control-to-scenario mapping so exposure reduction can be attributed across scenarios rather than within one. Then report each control's effect at both the average and a return period, so cross-cutting and tail-specific investments are distinguishable. None of that requires changing methodology, and scenario-based modeling remains the right foundation with the reporting unit changed.
The Lens Decides the Budget
Scenario-led and enterprise-wide analysis are not competing methodologies so much as different reporting units, and each produces a predictable bias in what gets funded. Scenario-led starves cross-cutting controls that appear everywhere and dominate nothing. Enterprise-wide starves defenses against rare severe events that barely move an average. Attributing reduction to controls rather than to scenarios resolves most of it, provided the effect is reported at both the average and a return period. Kovrr's cyber risk quantification reports control-level loss reduction across the portfolio alongside scenario detail, which is what makes both arguments available from one model.
To see which controls reduce the most exposure across your whole scenario set rather than within one, book a demo with our cyber risk experts.

Modeling Lens FAQs
Speak to an ExpertWhat does each modeling lens fund?

What does scenario-led analysis systematically underfund?
What does enterprise-wide analysis underfund?
How do you tell which lens a program uses?
How do you get both views without running two programs?
Which lens suits which audience?