
Blog Post
Kovrr’s Event Catalog Brings Unmatched Transparency to the Dashboard
November 2, 2026
TL;DR
- Trust is the binding constraint in cyber risk quantification, and a figure earns it when the people who have to rely on it can test it themselves.
- Kovrr’s transparency predates this release. The simulated data behind every run has always been downloadable in Excel and other formats.
- What the Event Catalog changes is the effort. Unparalleled transparency now sits in the management dashboard, where every event and every parameter can be queried and grouped with nothing to export.
- Every headline metric traces back to those events one operation at a time, including Average Annual Loss, the 1:100 Annual Loss and Loss by Event Type.
- The market talks a great deal about open frameworks, and none of that talk puts a client under the hood of their own run. Watching the model work is the only thing that builds trust between the vendor and the client and inside the client, where the numbers have to be adopted. Kovrr hands that un-fair advantage to its clients and partners.
Defending a Cyber Risk Figure Has Never Been Easier
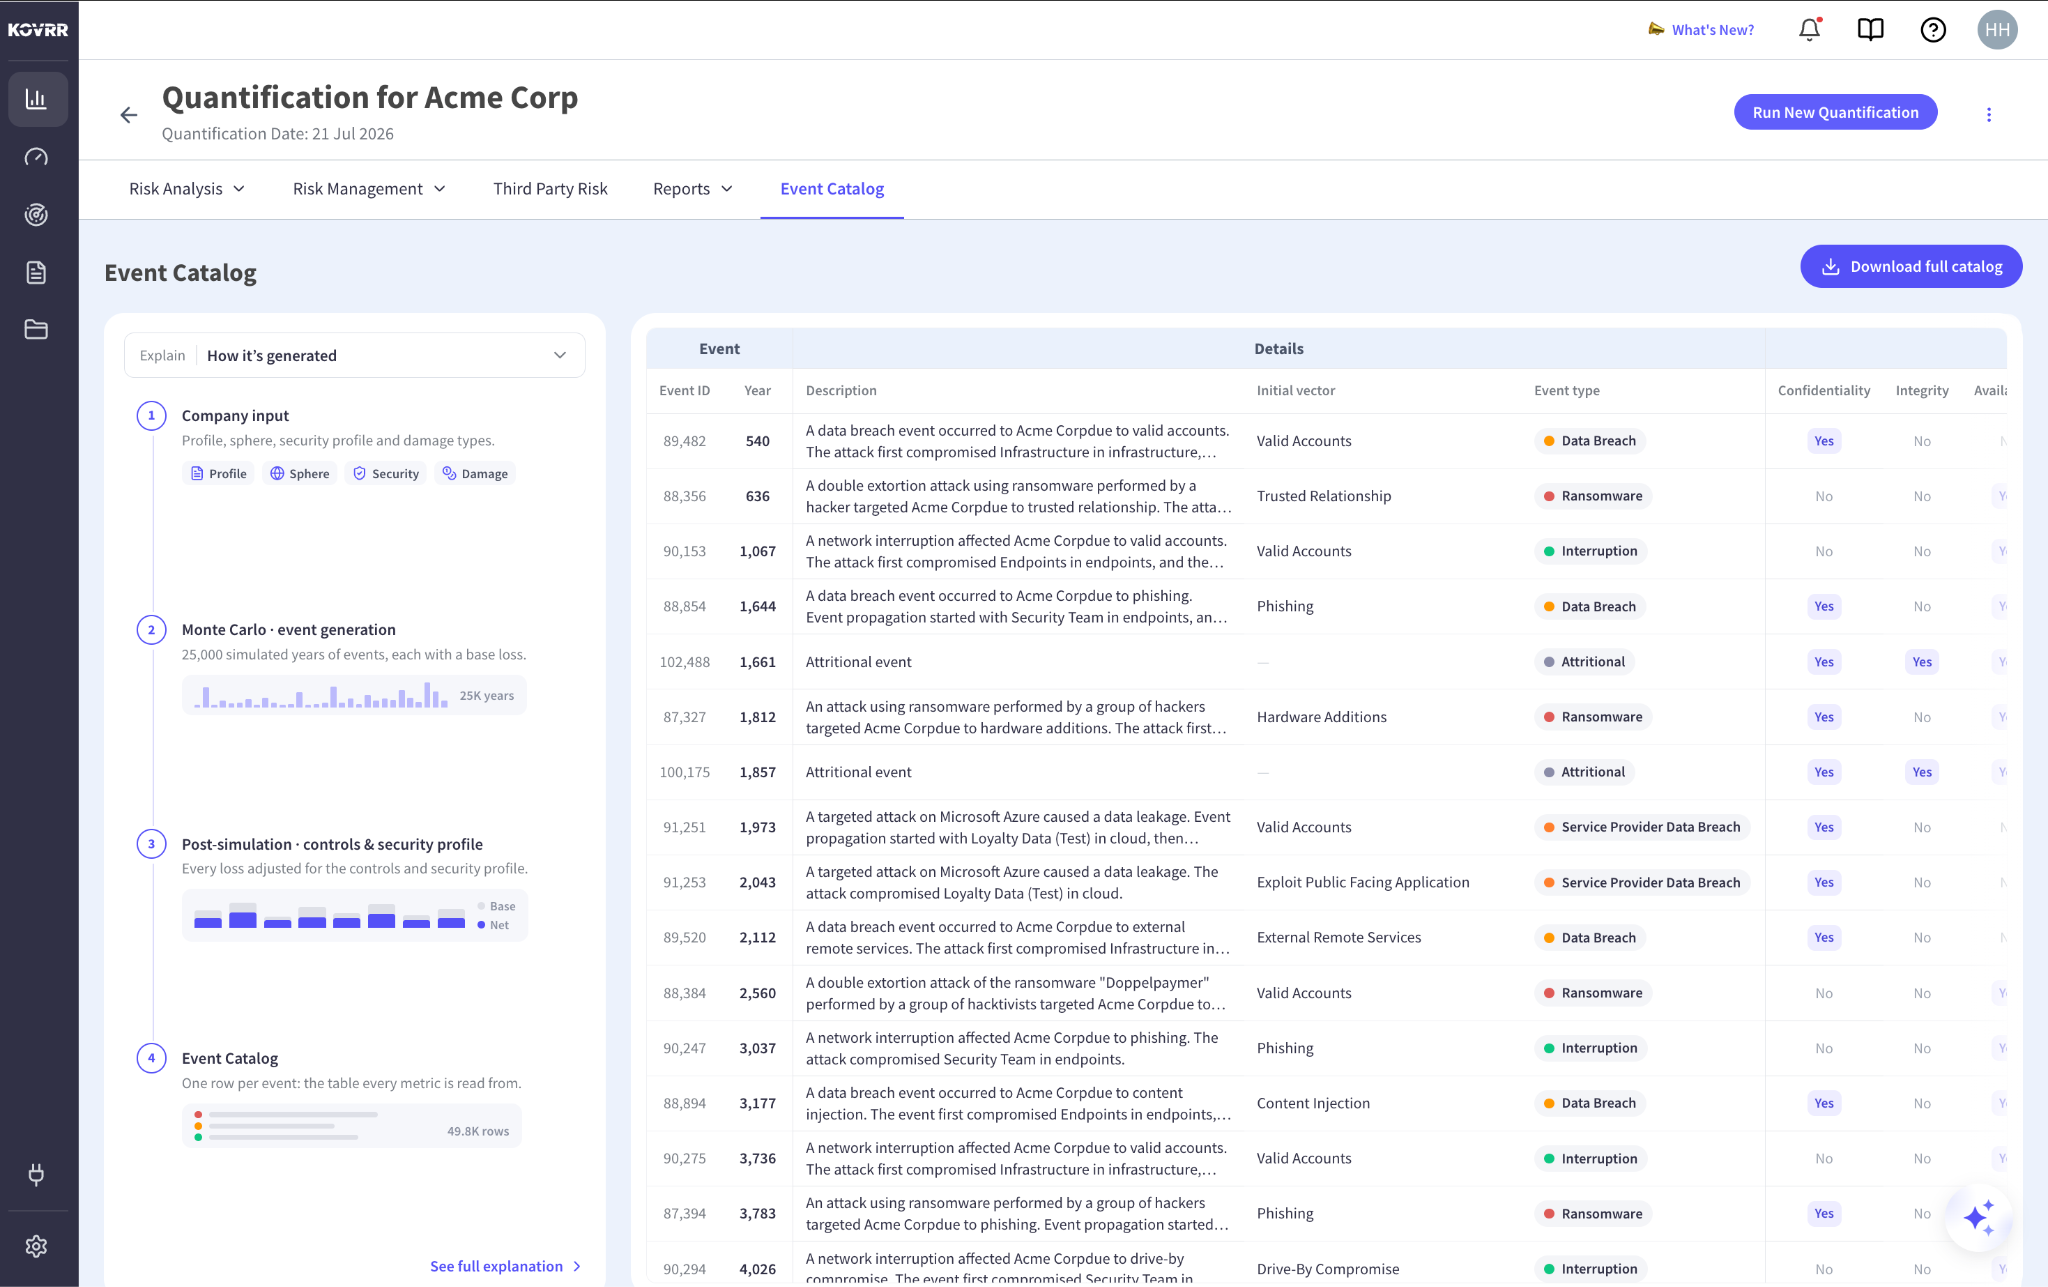
Most cyber risk quantification (CRQ) platforms ask for trust. They describe their data sources in general terms, display an average annual loss at the top of a screen, and offer nothing in between. Anybody wanting to check the number is asked to accept the connection on expert judgment alone, which is a reasonable thing to decline when the figure is about to support a nine-figure decision.
Kovrr has never worked that way. From day one, the platform has let users export every simulated event behind a run, which is where Kovrr planted its flag on unmatched transparency. That same data now sits in the management dashboard. Every quantification carries a tab holding the individual simulated events behind it, and every headline metric traces, operation by operation, down to the rows it was computed from. The entire set can be read, queried, and traced without leaving the platform.
The Integrated Bespoke Event Catalog Creation Process, Step-by-Step
The same panel that holds the catalog also explains how it was built. The Explain control at the top left opens with How it’s generated selected, which lays out the model run in four stages down the left rail, and selecting See full explanation opens those stages as a walkthrough, one screen at a time. None of the method sits in a separate document, which is what makes the explanation integrated into the product instead of adjacent to it.
Company Input
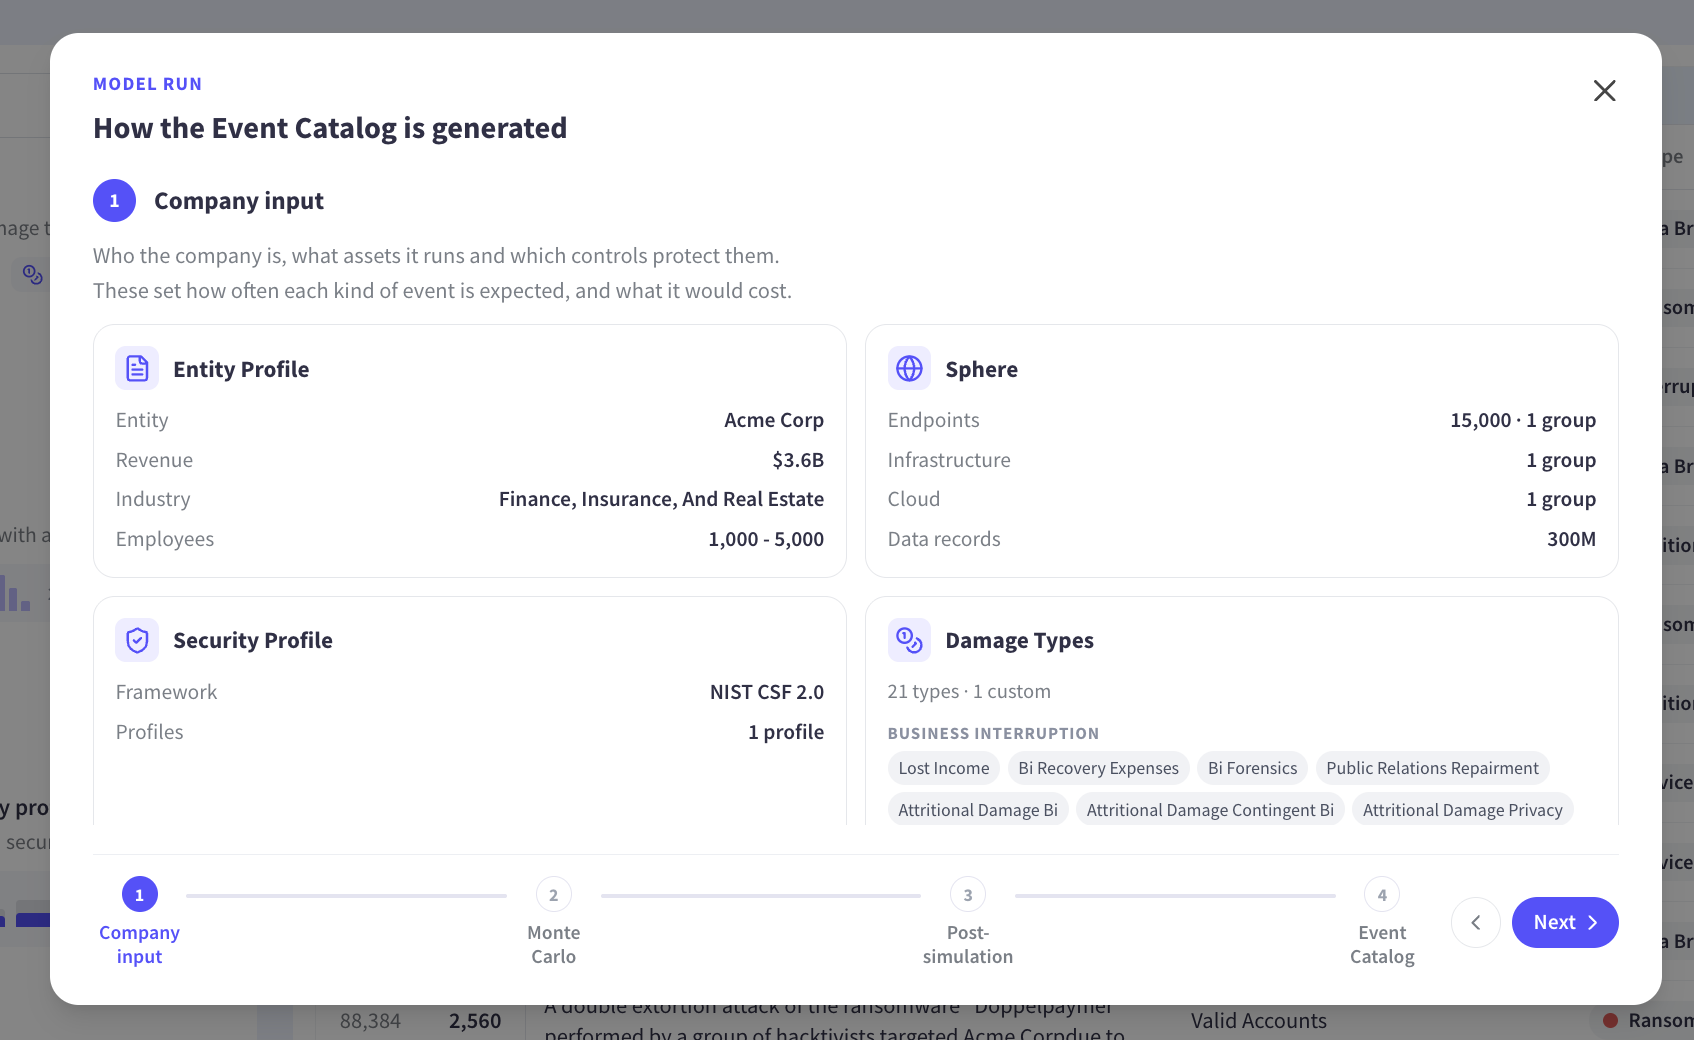
The stage displays four cards. Entity Profile carries the entity name, revenue, industry and employee band. Cyber-Sphere lists the asset groups the model works against, covering endpoints, infrastructure, cloud and data records. Security Profile names NIST CSF 2.0 and the number of profiles applied. Damage Types gives the count of loss categories in play, with the business interruption group listing Lost Income, Recovery Expenses, Forensics, Public Relations Repairment, Attritional Damage, Attritional Damage Contingent and Attritional Damage Privacy.
Reading this stage tells someone exactly which version of their organization the model was answering questions about. A quantification run before a cloud migration, or before a control uplift, rests on inputs that have since moved, and the stage makes those inputs legible instead of leaving them in a configuration screen nobody revisits. Traceability starts here, since a figure can only be followed back as far as the inputs behind it stay visible.
Monte Carlo and Event Generation
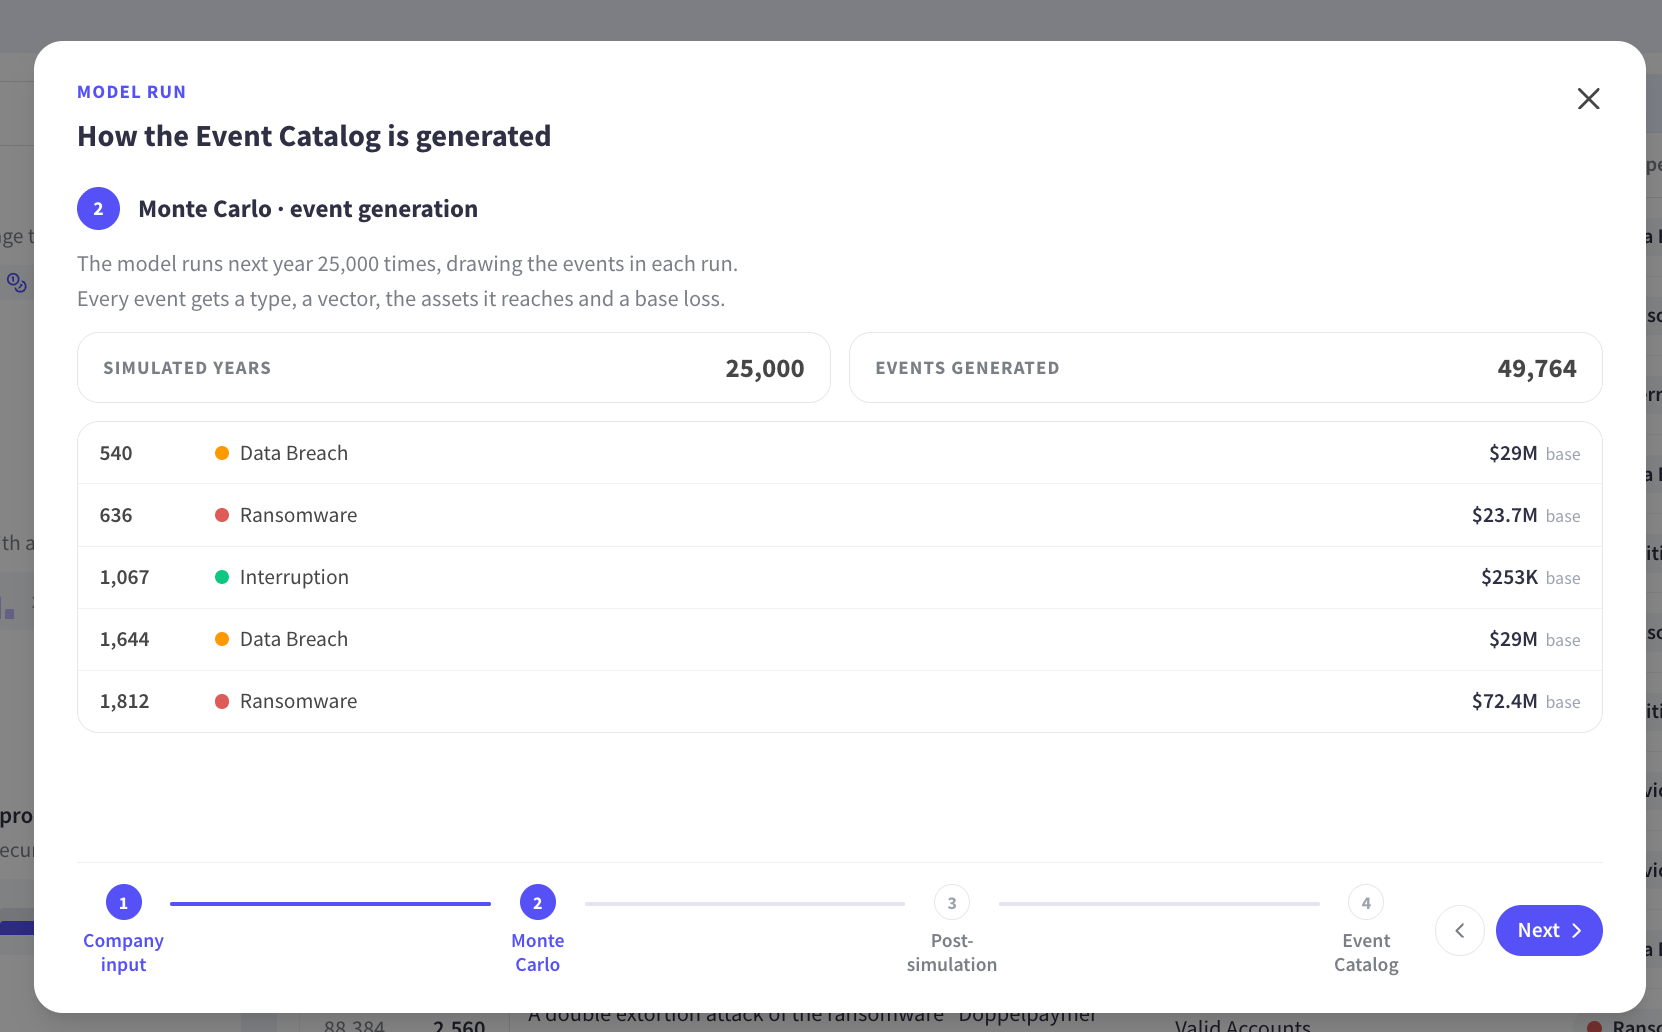
The stage shows two counters, Simulated Years and Events Generated. In the quantification shown, 25,000 simulated years produced the event set for that business alone, since the model draws only the events relevant to its technology profile instead of running a generic catalog against every company. Beneath the counters, a sample of generated events lists the simulated year, the event type and the base loss attached to each one, with data breaches and ransomware events carrying base losses in the tens of millions against interruption events in the hundreds of thousands.
Both counters matter to anyone evaluating the model. The number of simulated years governs how much of the tail the simulation has explored, and the number of events generated is the size of the table the rest of the platform computes against. Putting both on screen is the difference between being told a simulation ran and being shown what it produced, which is where transparency stops being a claim and starts being something a reviewer can check.
Post-Simulation Accounting for Controls and Security Profile
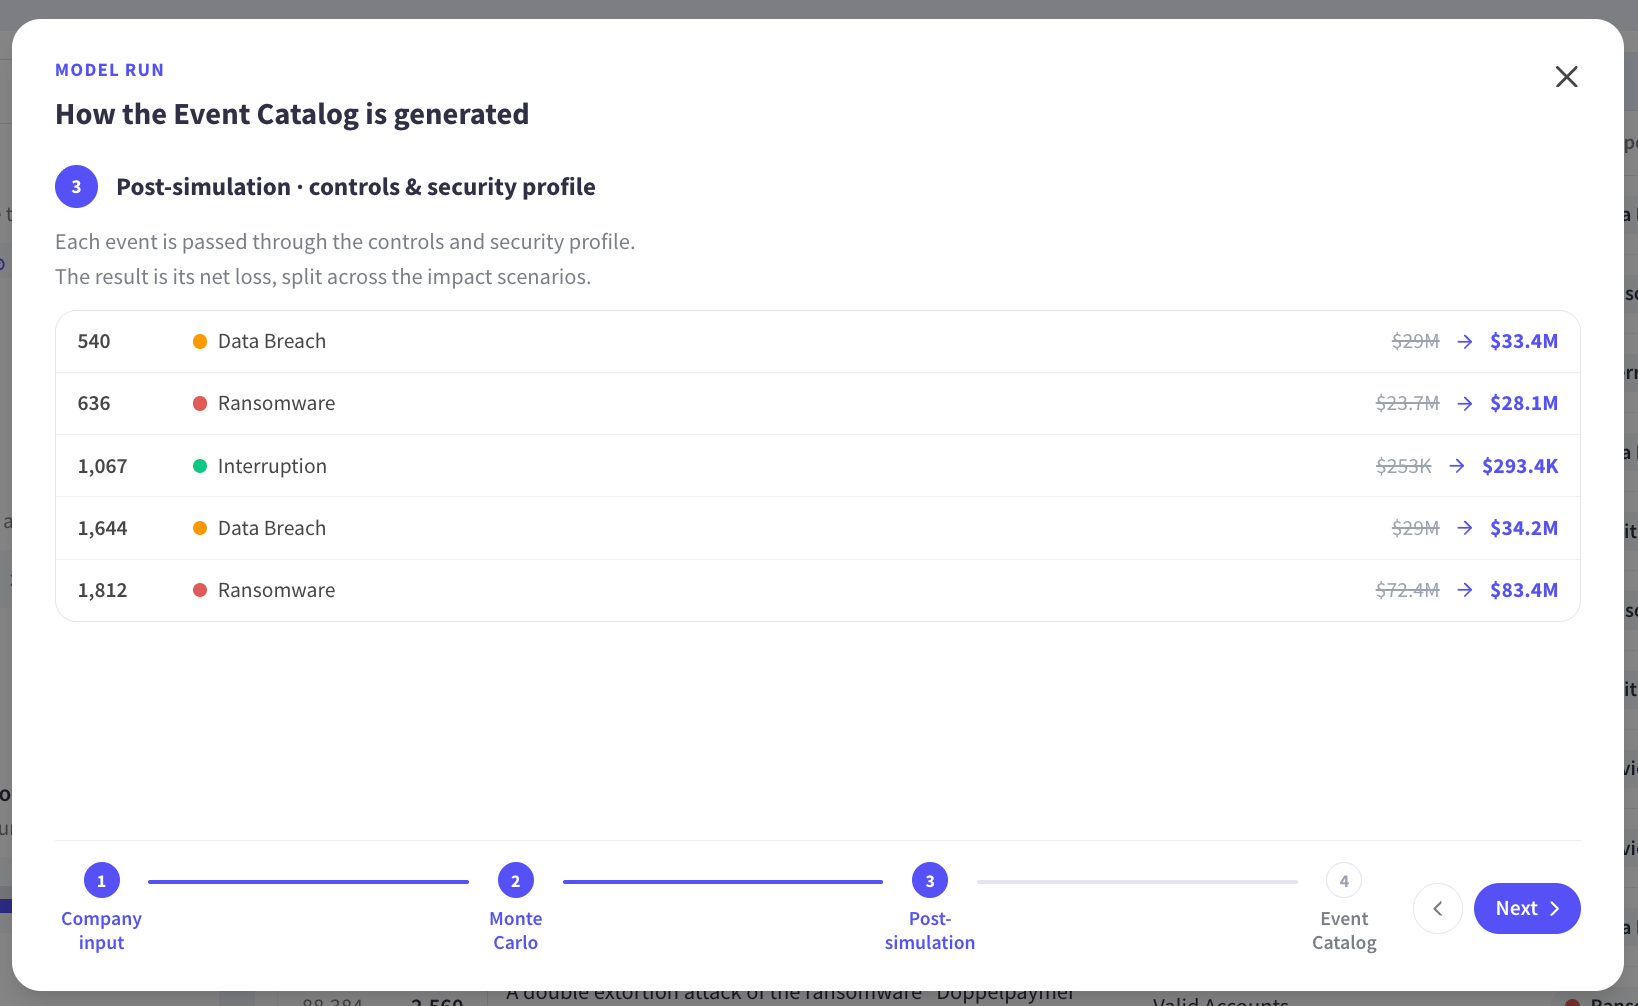
The stage sets each event’s base loss against its net loss, so every event carries what it would have cost the organization with no control posture at all and what it costs with the posture it has. The adjustment reflects the control posture captured in the first stage, and it is the step that makes two organizations with similar revenue and industry produce different numbers.
Seeing both figures side by side answers a question control owners ask constantly, which is what a given control posture is doing to the organization’s exposure in currency. It is also where traceability stops being theoretical, since a reviewer can follow what the model concluded and what the organization’s own defenses changed about it. The fourth and final stage, Event Catalog, then presents the completed table, one row per event, carrying the year, type, impacts, likelihood and loss.
Unparalleled Transparency: Every Metric Traces Back to the Table
Selecting a metric from the Explain dropdown replaces the model run view with a step-by-step derivation. The dropdown sorts its options into three groups. Event Catalog holds “How it’s generated.” Headline Metrics holds Average Annual Loss, 1:100 Annual Loss, Annual Event Likelihood and Peer Base Rate. Exposure Breakdown holds Loss by Event Type.
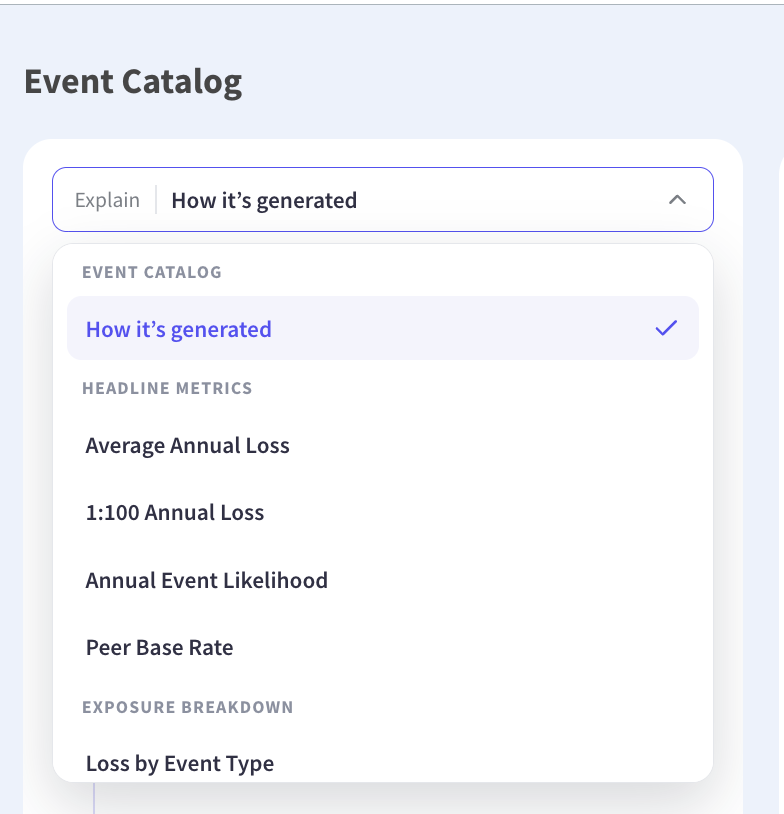
Each derivation behaves the same way. The table reorders so the columns taking part move to the left under an In Calculation header, every column outside the calculation fades back, and the panel advances one operation at a time with the intermediate values filled in as it goes. A reader follows the arithmetic against live data instead of a worked example in a methodology document.
Transparency turns into traceability at this point. A figure that can be followed down to the rows that produced it can be tested by the people who have to rely on it, and a figure that survives that test is one a board, a second line function, or a regulator can trust. Following a derivation against live rows is what a client cannot do anywhere else, and it is the un-fair part of the advantage.
Average Annual Loss (AAL)
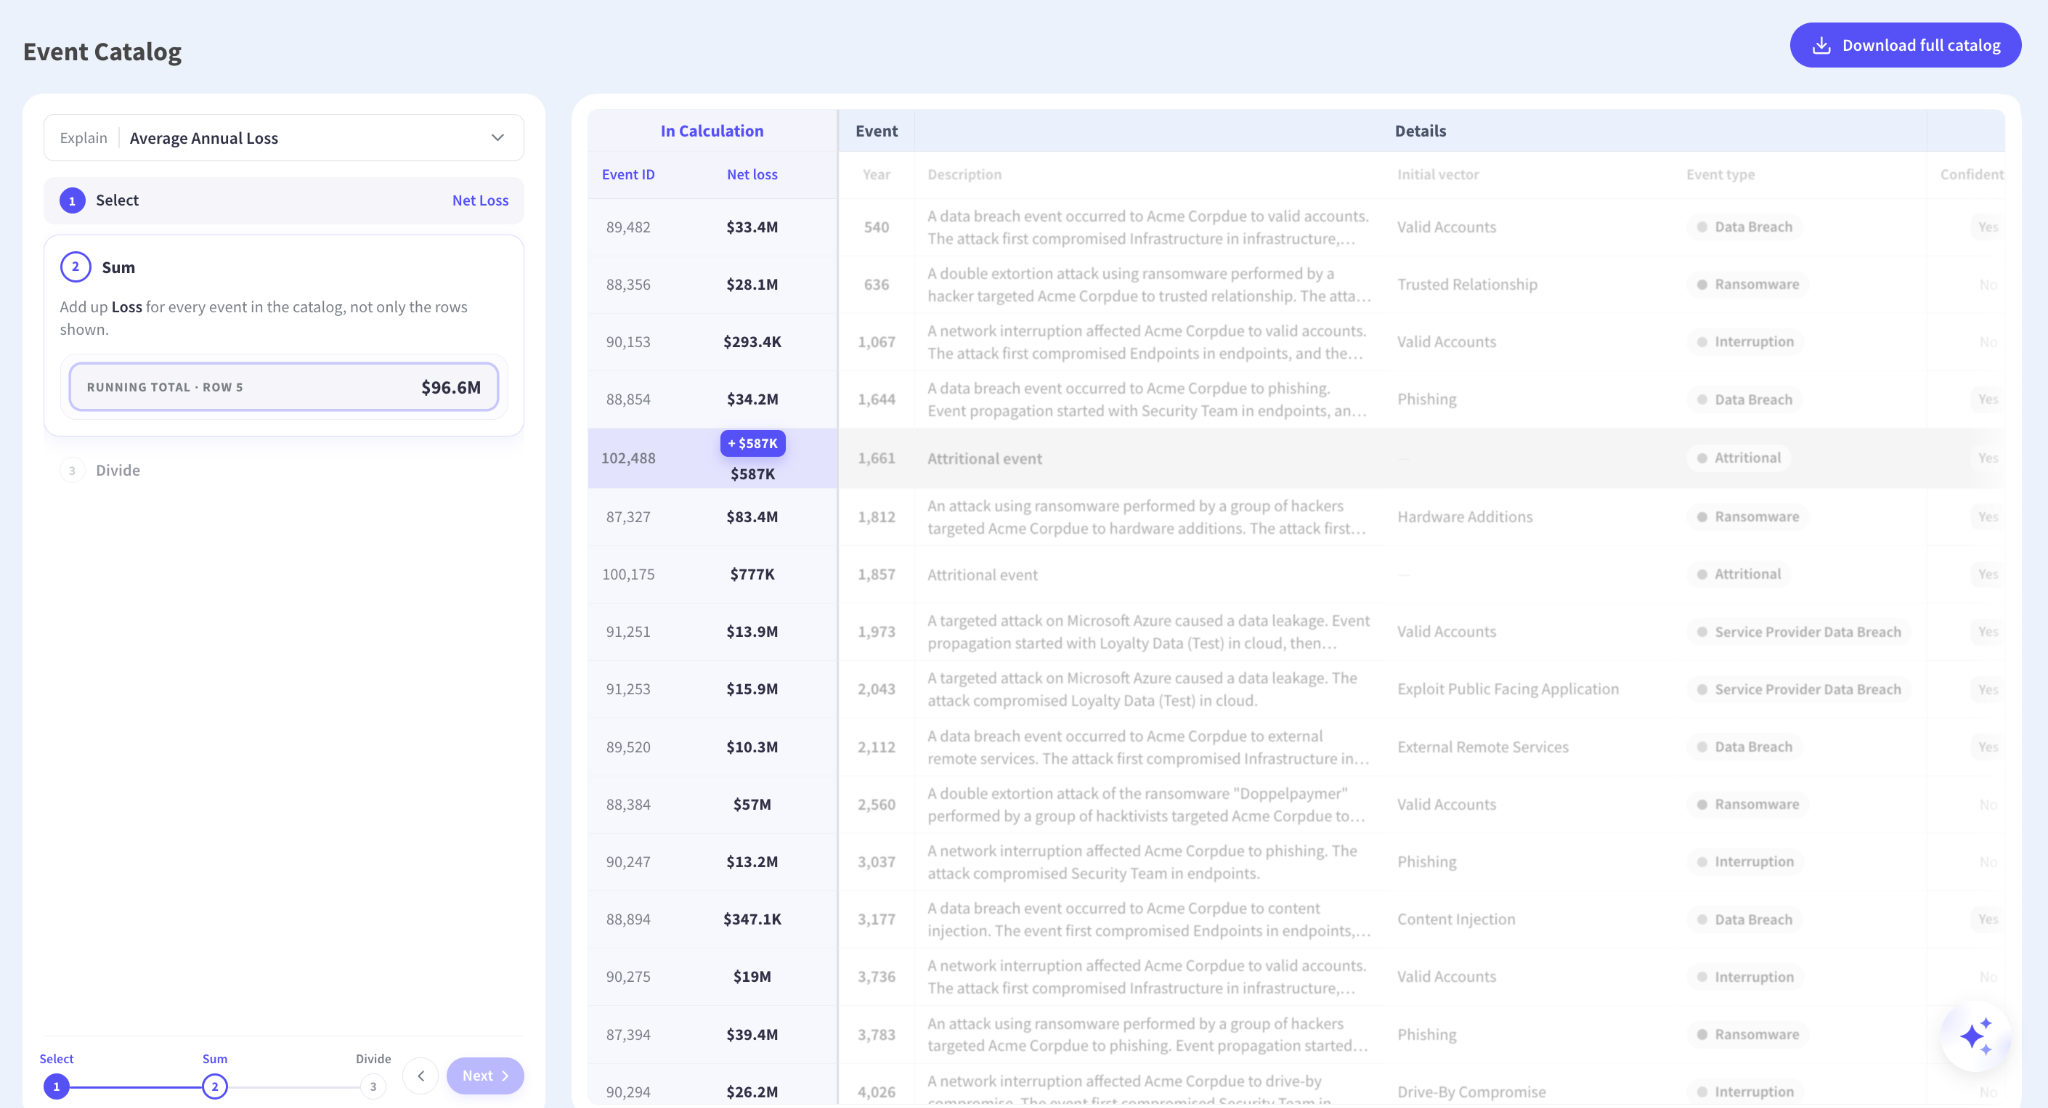
Average Annual Loss resolves in three operations. Select identifies the single column the metric reads, which is Net loss. Sum adds that column across every event in the catalog, including the rows below the fold, with the panel reporting a running total as it works down the table. Divide spreads that total across all 25,000 simulated years, including the years in which nothing happened, which returns the Average Annual Loss.
The completed panel holds all three operations with their values, so somebody can read the whole derivation without stepping through it again. Three operations is the entire method behind the headline figure, and traceability means a reviewer who disputes the result can point at the operation they dispute instead of rejecting the number whole.
1:100 Annual Loss
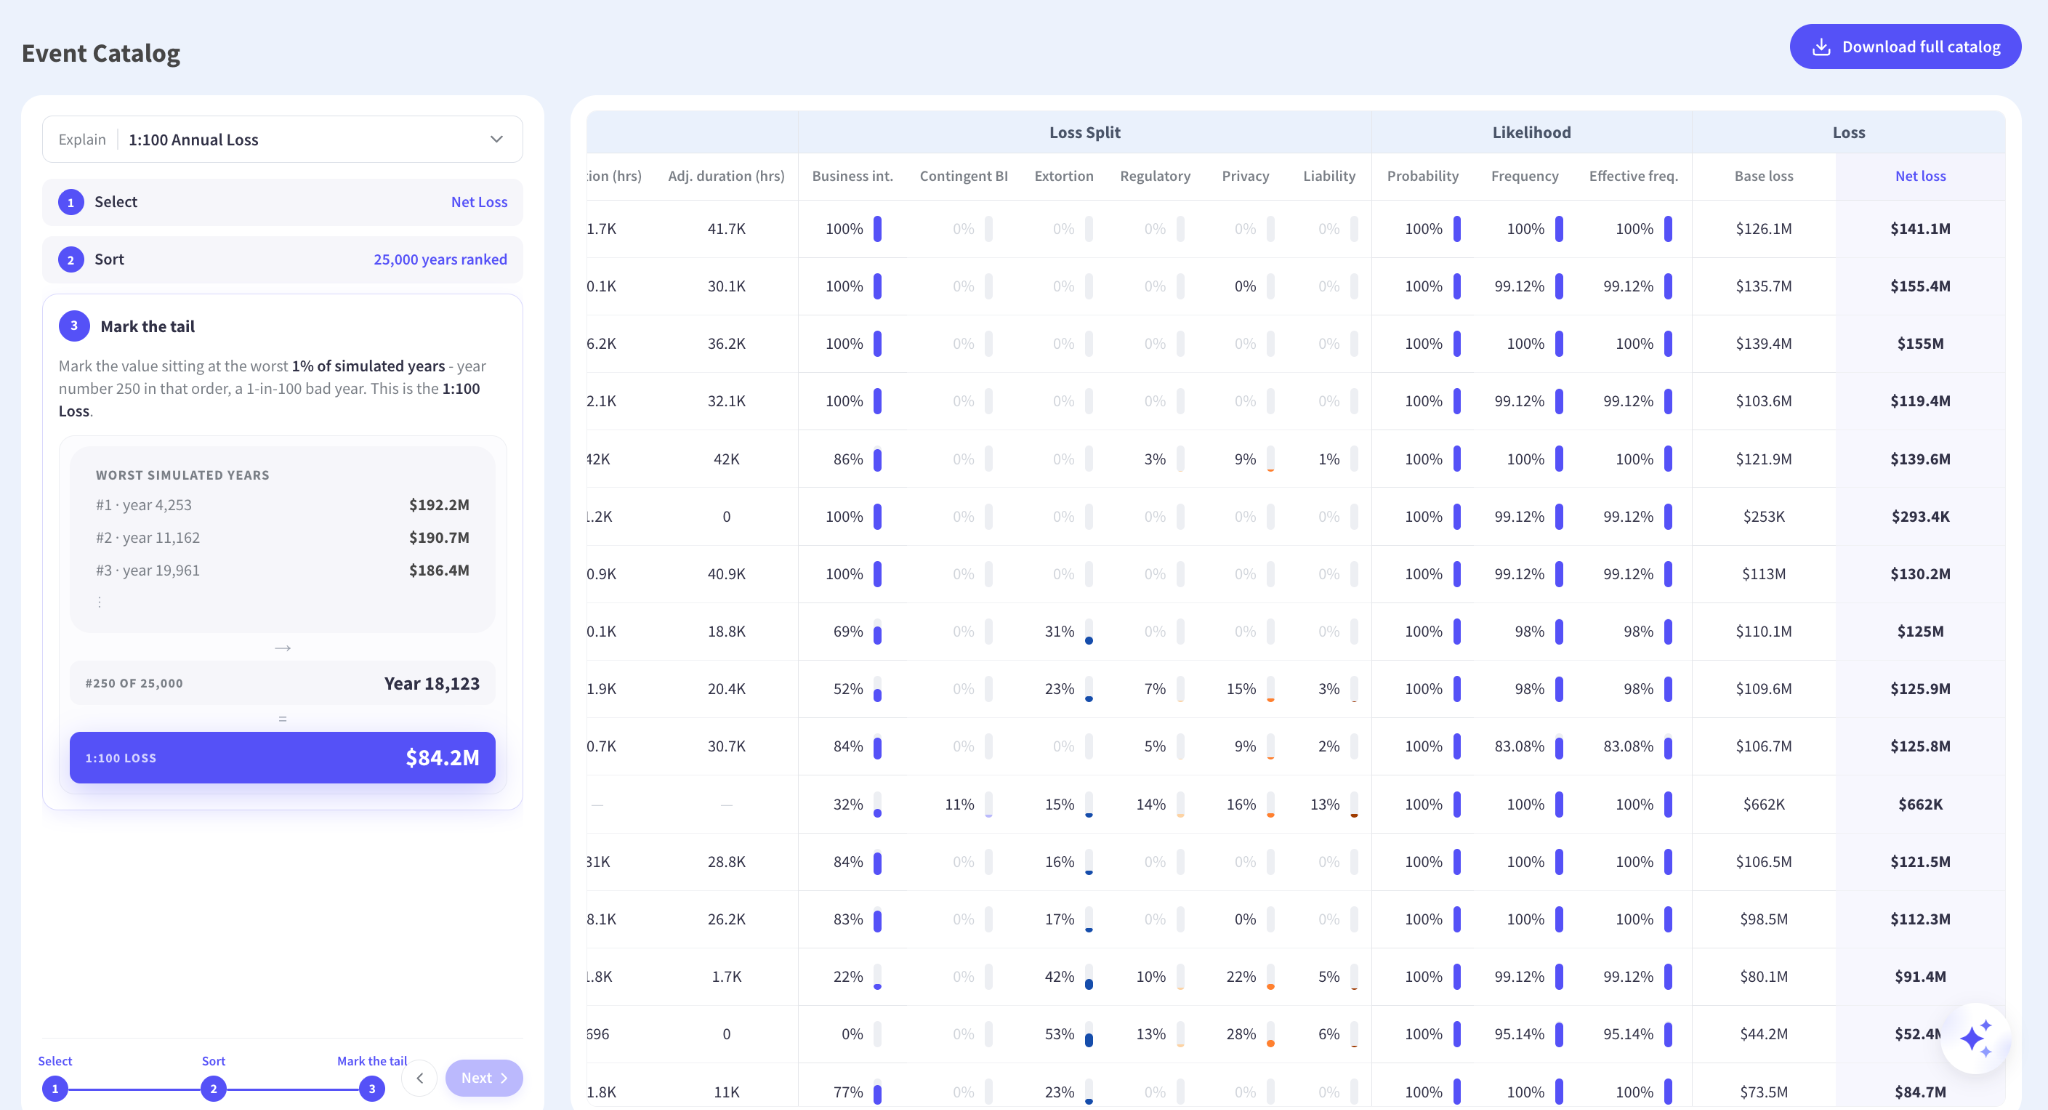
The tail metric reads the same Net loss column and puts it to a different use. The Sort function totals each simulated year’s losses and ranks all 25,000 years from most severe to least, surfacing the worst of them. “Mark the tail” then takes the year sitting at position 250 of 25,000, which is year 18,123 in the quantification shown, and reports its total as the 1:100 Annual Loss.
Naming the specific simulated year changes the character of the conversation, since a one in a hundred year outcome stops being an abstraction and becomes a year somebody can open and inspect. The events inside it, the vectors they arrived through and the losses they caused all sit in the table the figure was read from, which is traceability applied to the number boards ask about most.
Loss by Event Type
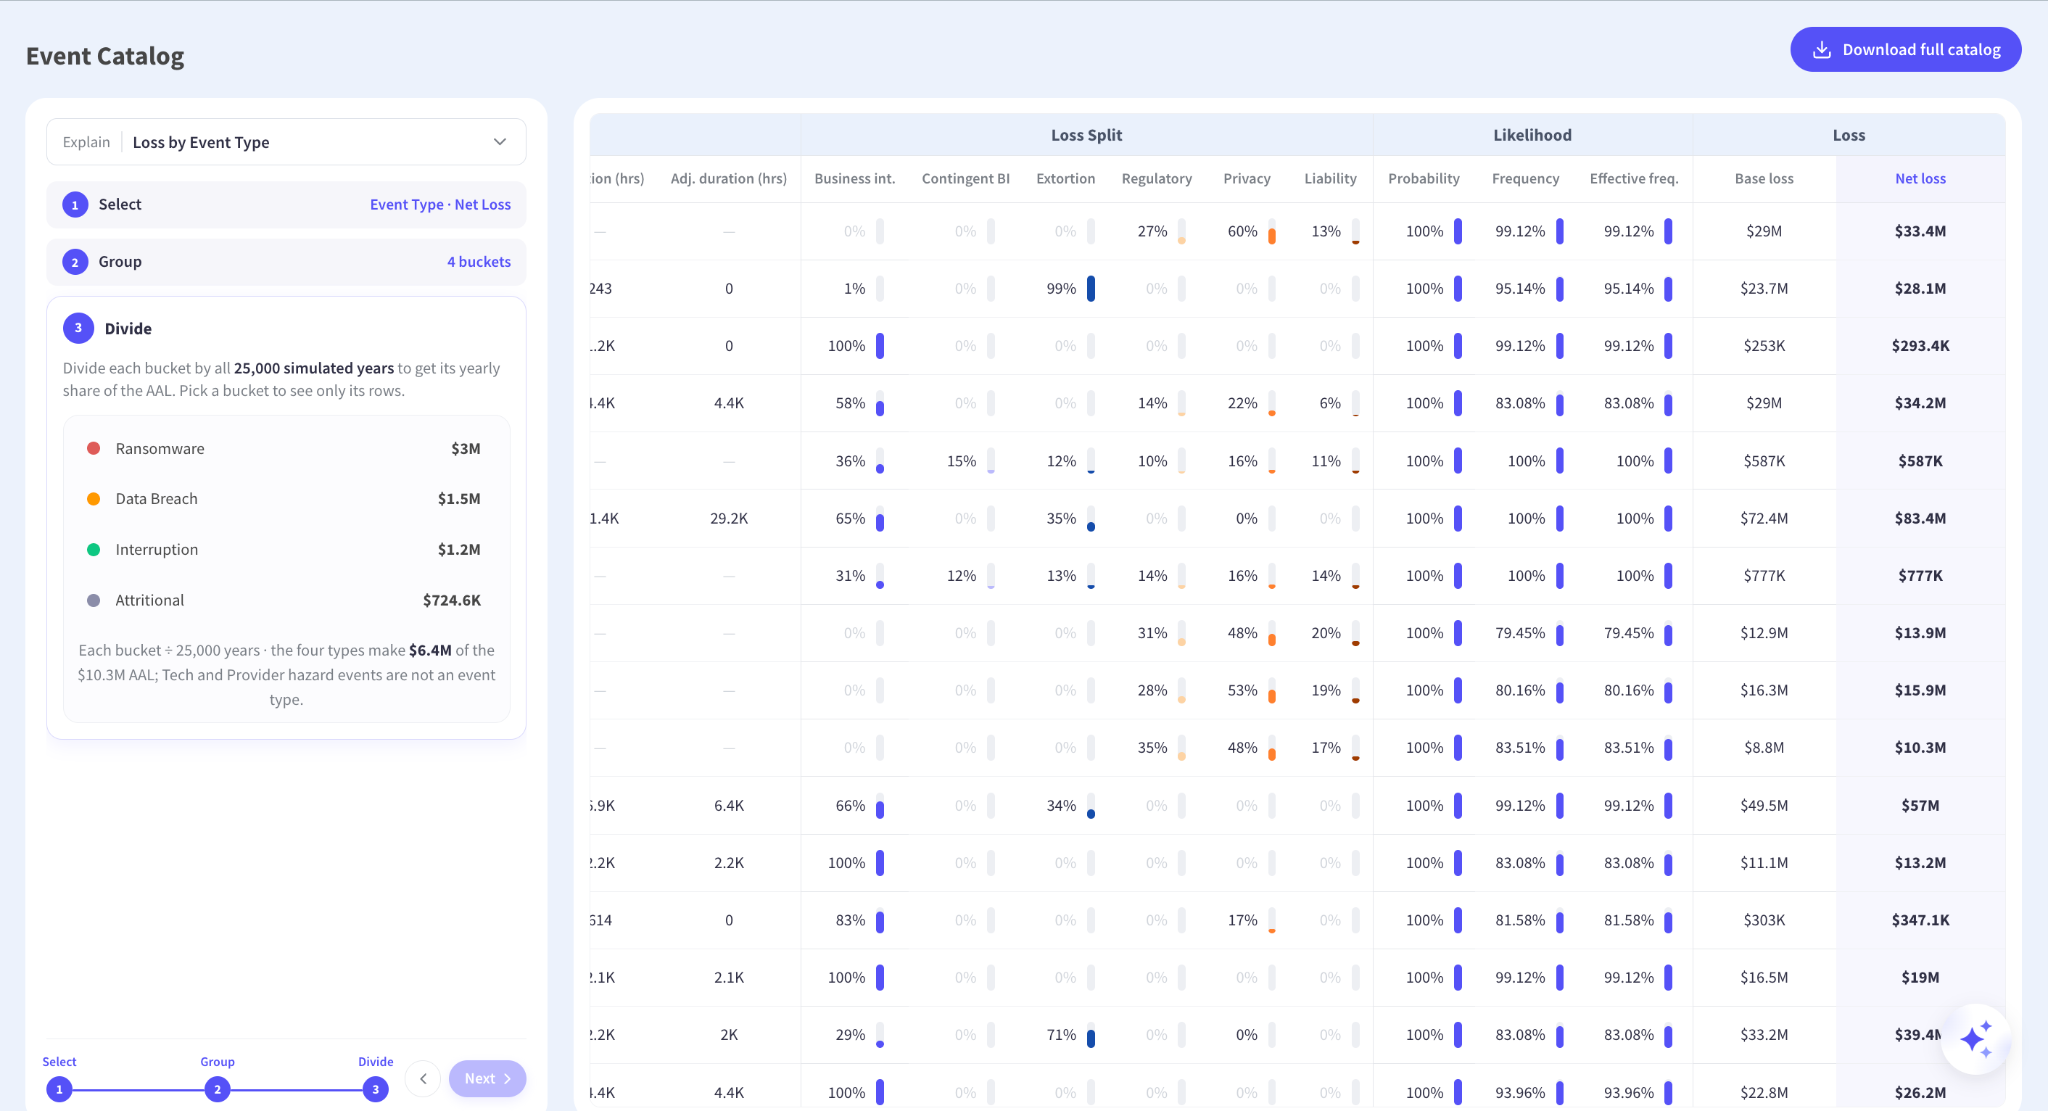
The exposure breakdown reads two columns: Event type and Net loss. Group routes every event’s loss into its event type bucket, producing four of them, covering Ransomware, Data Breach, Interruption and Attritional across the full simulation. Divide then converts each bucket into a yearly figure, so the annual cost of each threat lands next to the others.
The panel also states how much of the Average Annual Loss those four types account for, since Tech and Provider hazard events are not an event type. Volunteering the remainder is the detail that makes the rest of the breakdown credible, because a view that silently implied the buckets summed to the whole would be inviting someone to discover otherwise. Showing what a breakdown leaves out is a smaller thing than showing what it includes, and it does considerably more for trust.
The Un-fair Advantage Kovrr Hands Its Clients and Partners
The credibility problem in cyber risk quantification has never been the mathematics. Monte Carlo simulation is well understood, loss distributions are standard actuarial equipment, and nobody in a risk committee objects to the principle of expressing exposure in currency. The objection has been to the distance between the data a vendor describes and the figure a vendor displays, and that distance is where a quantified number loses arguments it should win.
Kovrr closed that distance long ago, and the Event Catalog makes crossing it effortless. A second line reviewer can test the derivation, an auditor can sample the rows, an actuary can take the downloaded catalog into their own tools, and a board member who asks where the number came from gets answered in the meeting instead of in a follow-up. The events were always in the model. Putting them a click away, with the route from any metric down into them, is what turns a quantification into evidence.
Open frameworks are discussed everywhere and demonstrated almost nowhere. Unmatched transparency is what builds trust in a number, with the vendor and inside the client, and it is the un-fair advantage those clients carry into every room where the figure gets questioned.
Open the Event Catalog on your own exposure, trace any figure down to the events behind it, and take the table away with you. Schedule a free demo with one of Kovrr’s cyber risk management experts today.


Cyber Event Catalog FAQs
Speak to an ExpertAre proprietary cyber risk quantification models black boxes?

Where is the Event Catalog in the platform?
Which metrics can be traced back to the event rows?
What does the explanation panel show about how the catalog is generated?
Do the loss figures account for the organization’s security controls?
Can a reviewer reproduce a headline figure outside the platform?