Blog Post
How Kovrr's Cyber Risk Quantification Model Works
November 3, 2026
A quantified cyber risk figure arrives as a single number, and the first thing a board member, a regulator, an auditor or an actuary wants is the route back to whatever produced it. Most vendors answer that request with documentation about method. Documentation and evidence are different things. Somebody checking a figure needs to reach the records underneath it, the way an auditor works from a financial statement into the accounts and then into individual transactions. What separates one cyber risk quantification (CRQ) platform from another is whether those records open to someone outside the vendor.
Does the Framework Settle It?
The question collapses two separate ones. The first asks which method a platform uses to reason about risk. Factor decomposition and actuarial fitting are both legitimate, both run in production, and they produce different answers from apparently identical inputs for four identifiable reasons. The second asks whether anyone outside the vendor can examine what the method ran on. A platform can answer the first fully and the second not at all, which is how a well documented model still leaves a buyer holding a number they cannot defend.
Naming FAIR, or naming an actuarial approach, describes a structure for reasoning. It says nothing about whether the loss data behind a figure can be inspected. The distinction matters most at the moment somebody challenges the number, because a structure for reasoning survives that challenge only when the inputs it ran on can be produced. The difference between a CRQ model and a CRQ framework runs along the same line.
Which One a Buyer Is Usually Asking
Buyers ask the second question in the words of the first. Somebody asking whether a model is a black box rarely wants to know which taxonomy sits underneath. They want to know what they can put on the table when a figure gets challenged in a room where they are the only person who understands it. The answer that satisfies that room is a set of records somebody else can open and recalculate, which is a different kind of answer from a methodology document.
What Is the Loss Data Made Of?
Kovrr’s models draw on threat intelligence feeds, vulnerability and exploit databases, outage data and proprietary cyber insurance claims data. The first three describe the threat landscape, covering who is being targeted, what is being exploited, how long things stay down and which sectors absorb the disruption. The claims data describes something narrower and harder to obtain, which is what the resulting losses cost once somebody settled them. That last category is what separates cyber risk quantification built on a model from an exercise that turns a company’s own estimates into a figure.
Paid Losses and Reported Losses Are Different Populations
A publicly reported incident figure is an estimate produced under disclosure pressure, often early, often by the affected company. A claim is a figure an insurer arrived at after adjusting the loss, with the settlement behind it. The two populations diverge, and a severity distribution fitted to reported figures inherits whatever bias the reporting carried, including the incidents nobody reported at all. Models calibrated on paid losses sit closer to what an event costs the company absorbing it, which is the figure a board is being asked to approve a budget against.
How Is One Company's Frequency Derived?
The simulation produces it. The model takes the company’s own profile, covering revenue, industry, employee count, data records, the asset groups in scope and security posture measured against NIST CSF 2.0. It then runs the coming year 25,000 times. Each run draws the events that befall a company of that description, and every event carries a type, an initial vector, the assets it reached and a base loss. The Monte Carlo method behind those runs is what makes the count reproducible.
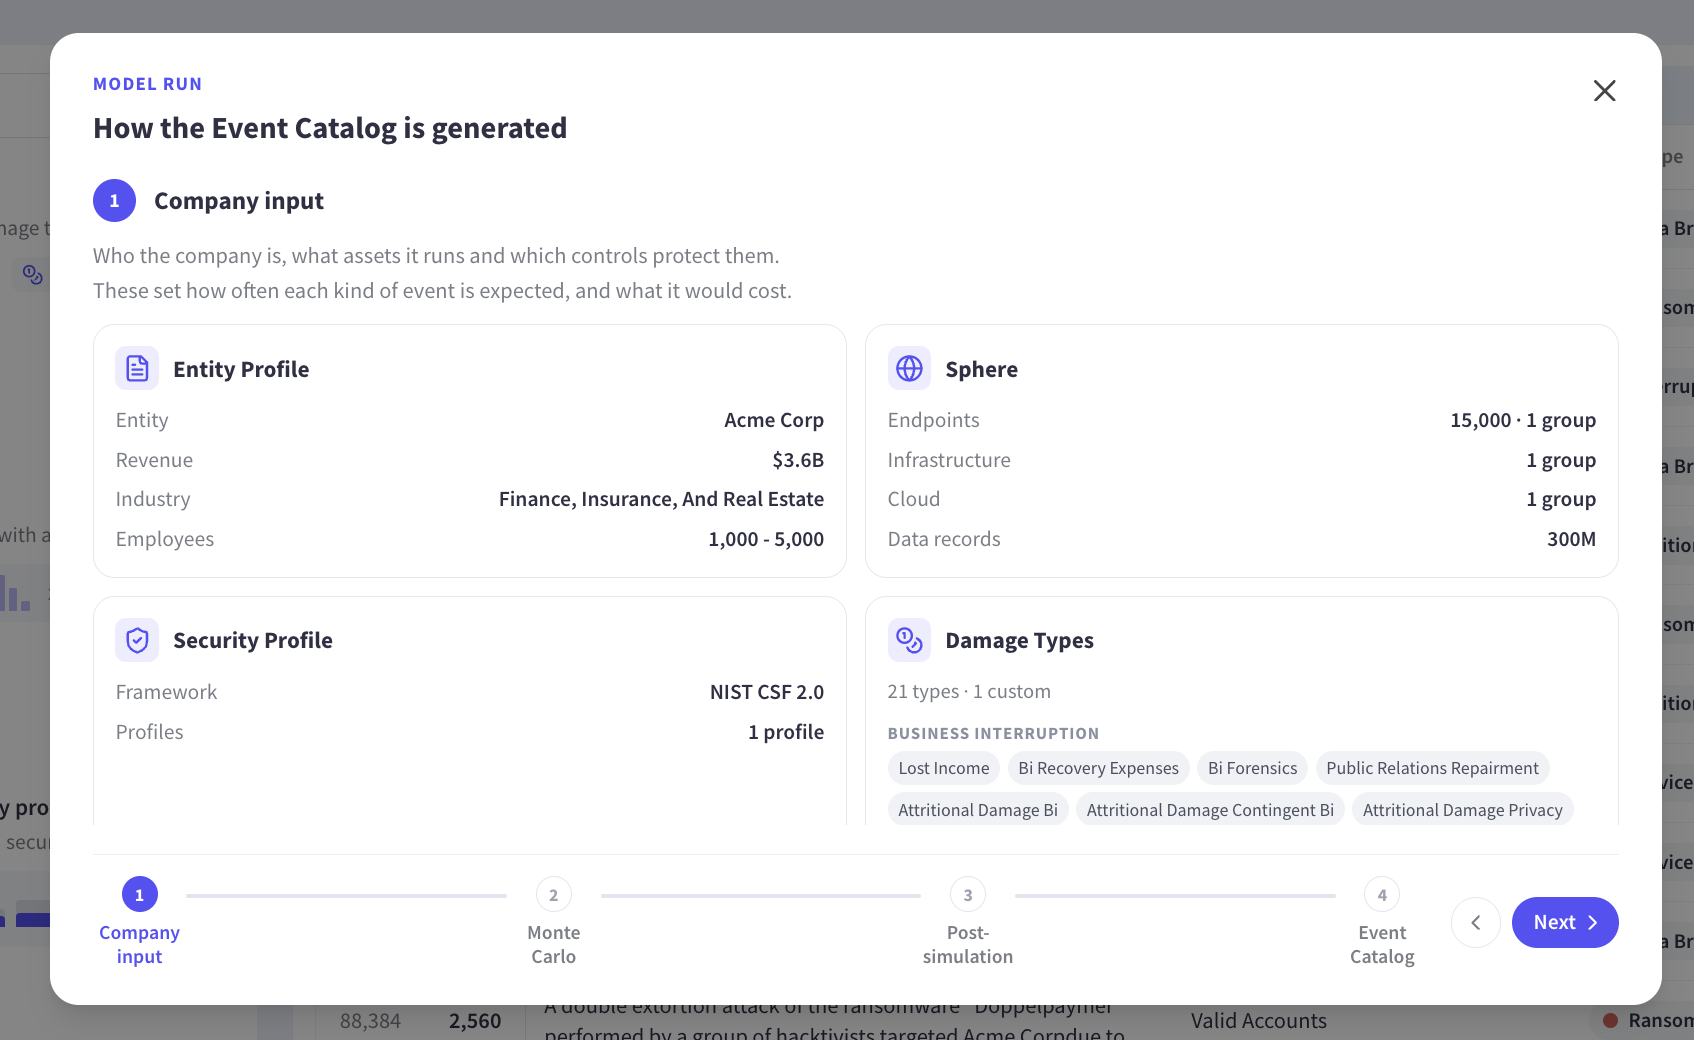
Event likelihood falls out of those runs, and nobody assigns it in advance from an industry table. A company whose profile puts it in the path of more of the modeled events sees more of them across the 25,000 years, and the figure reported back is a count of what the simulation did. Two companies in the same industry with different asset groups and different control coverage come out of the same engine with different likelihoods, which is the practical consequence of modeling the company instead of the sector.
Three Catalogs Feed One Quantification
Systemic events are broad attacks capable of reaching many companies at once through a region, a sector, a shared technology or a common service provider, and one systemic catalog applies to everyone, updating as the threat landscape moves. Targeted events are aimed at a single organization and are built from that company's own profile, so both frequency and event detail are customized. Attritional losses are the small ones absorbed across a year without any single incident registering, modeled in aggregate and scaled to the company.
No two companies receive the same combination. The model runs against the firmographics of one entity, so the systemic catalog it draws from is the same one everybody draws from while the targeted and attritional portions are built for that company alone. An industry average would collapse all three into a single rate, and a quantification stays defensible only because somebody can see which of the three a given figure came from.
What Happens Between Base Loss and Net Loss?
Every simulated event passes through the company’s controls and security profile, and the result is recorded against that event. Control posture applies per event instead of as one adjustment to a finished total, which is why two companies with identical base losses separate once their control coverage differs.
The net figure is then split across business interruption, contingent business interruption, extortion, regulatory, privacy and liability. Those categories line up with standard insurance coverage sections, so a modeled distribution can be read straight against a policy without a translation step in between.
Can a Figure Be Followed Back to Its Rows?
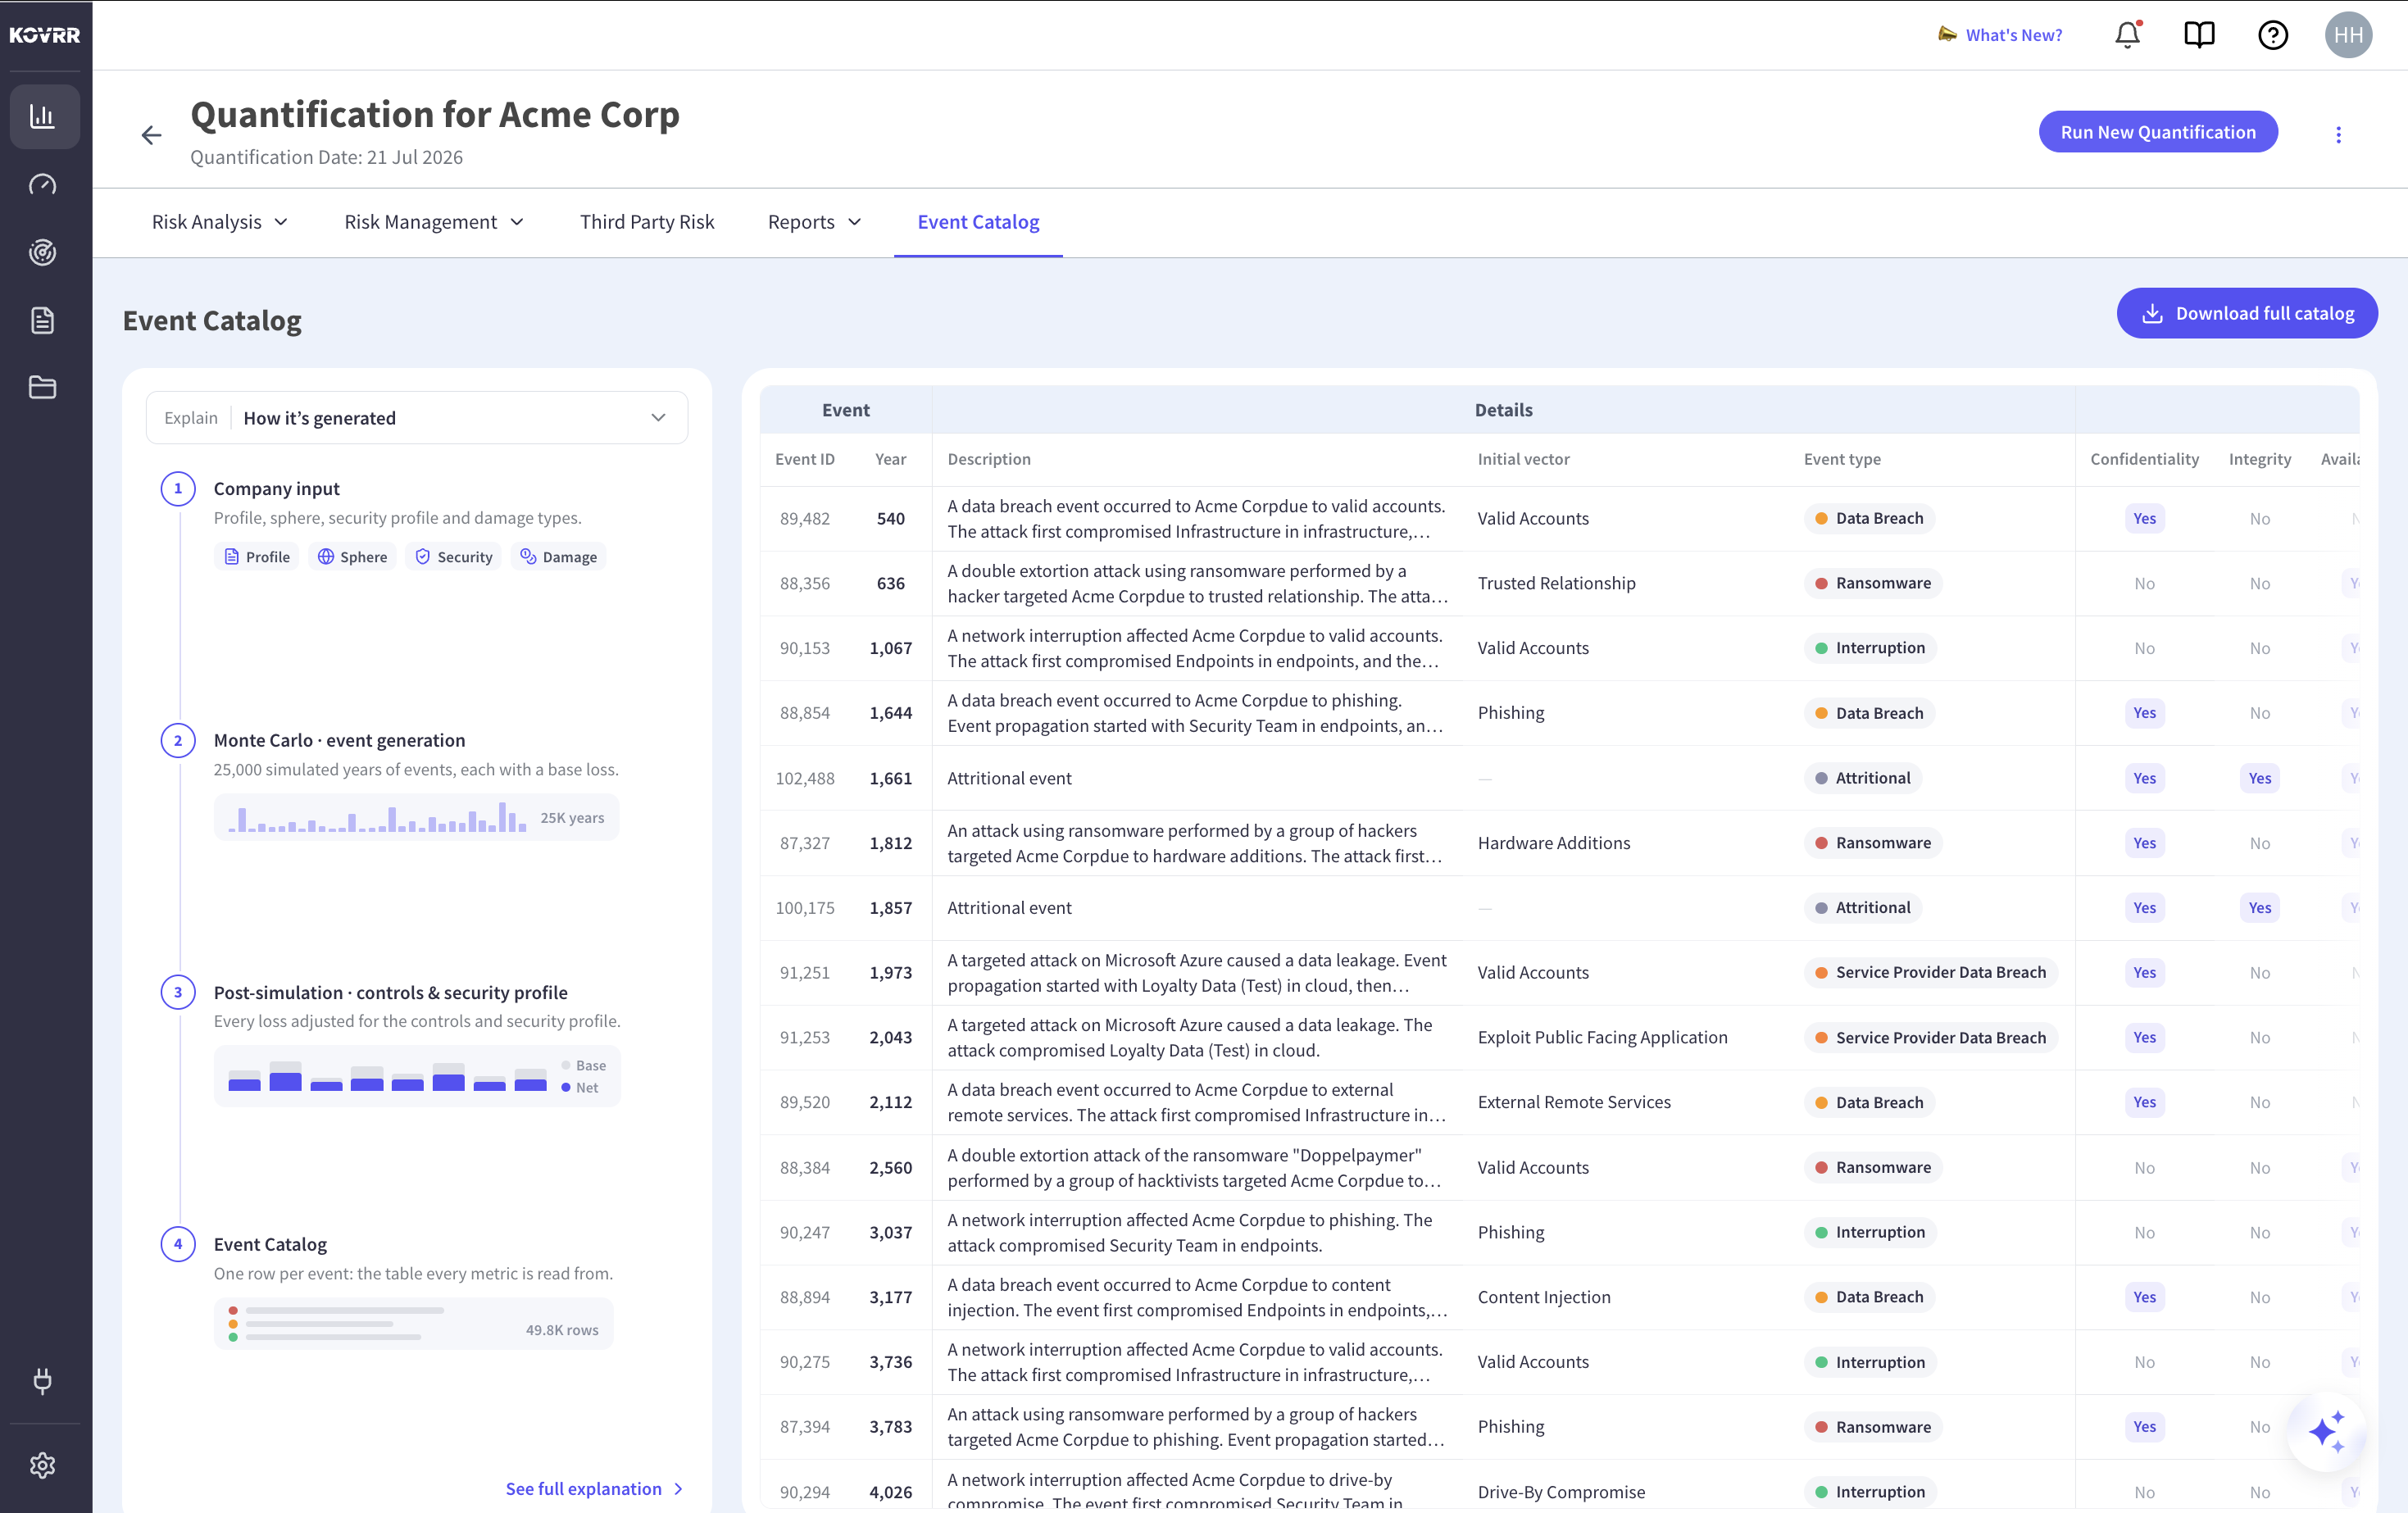
The Event Catalog holds each event the model generated, carrying its simulated year, a written description of how the attack unfolded against that company’s assets, the vector, the type, outage duration and the loss split. It downloads in full. A reader who wants to know which events drove a figure can open the rows and read them, and a reader who wants to check the figure can recalculate it in a spreadsheet.
The bespoke event catalog page covers how the three catalog types are assembled for one entity.
Average Annual Loss, One Operation at a Time
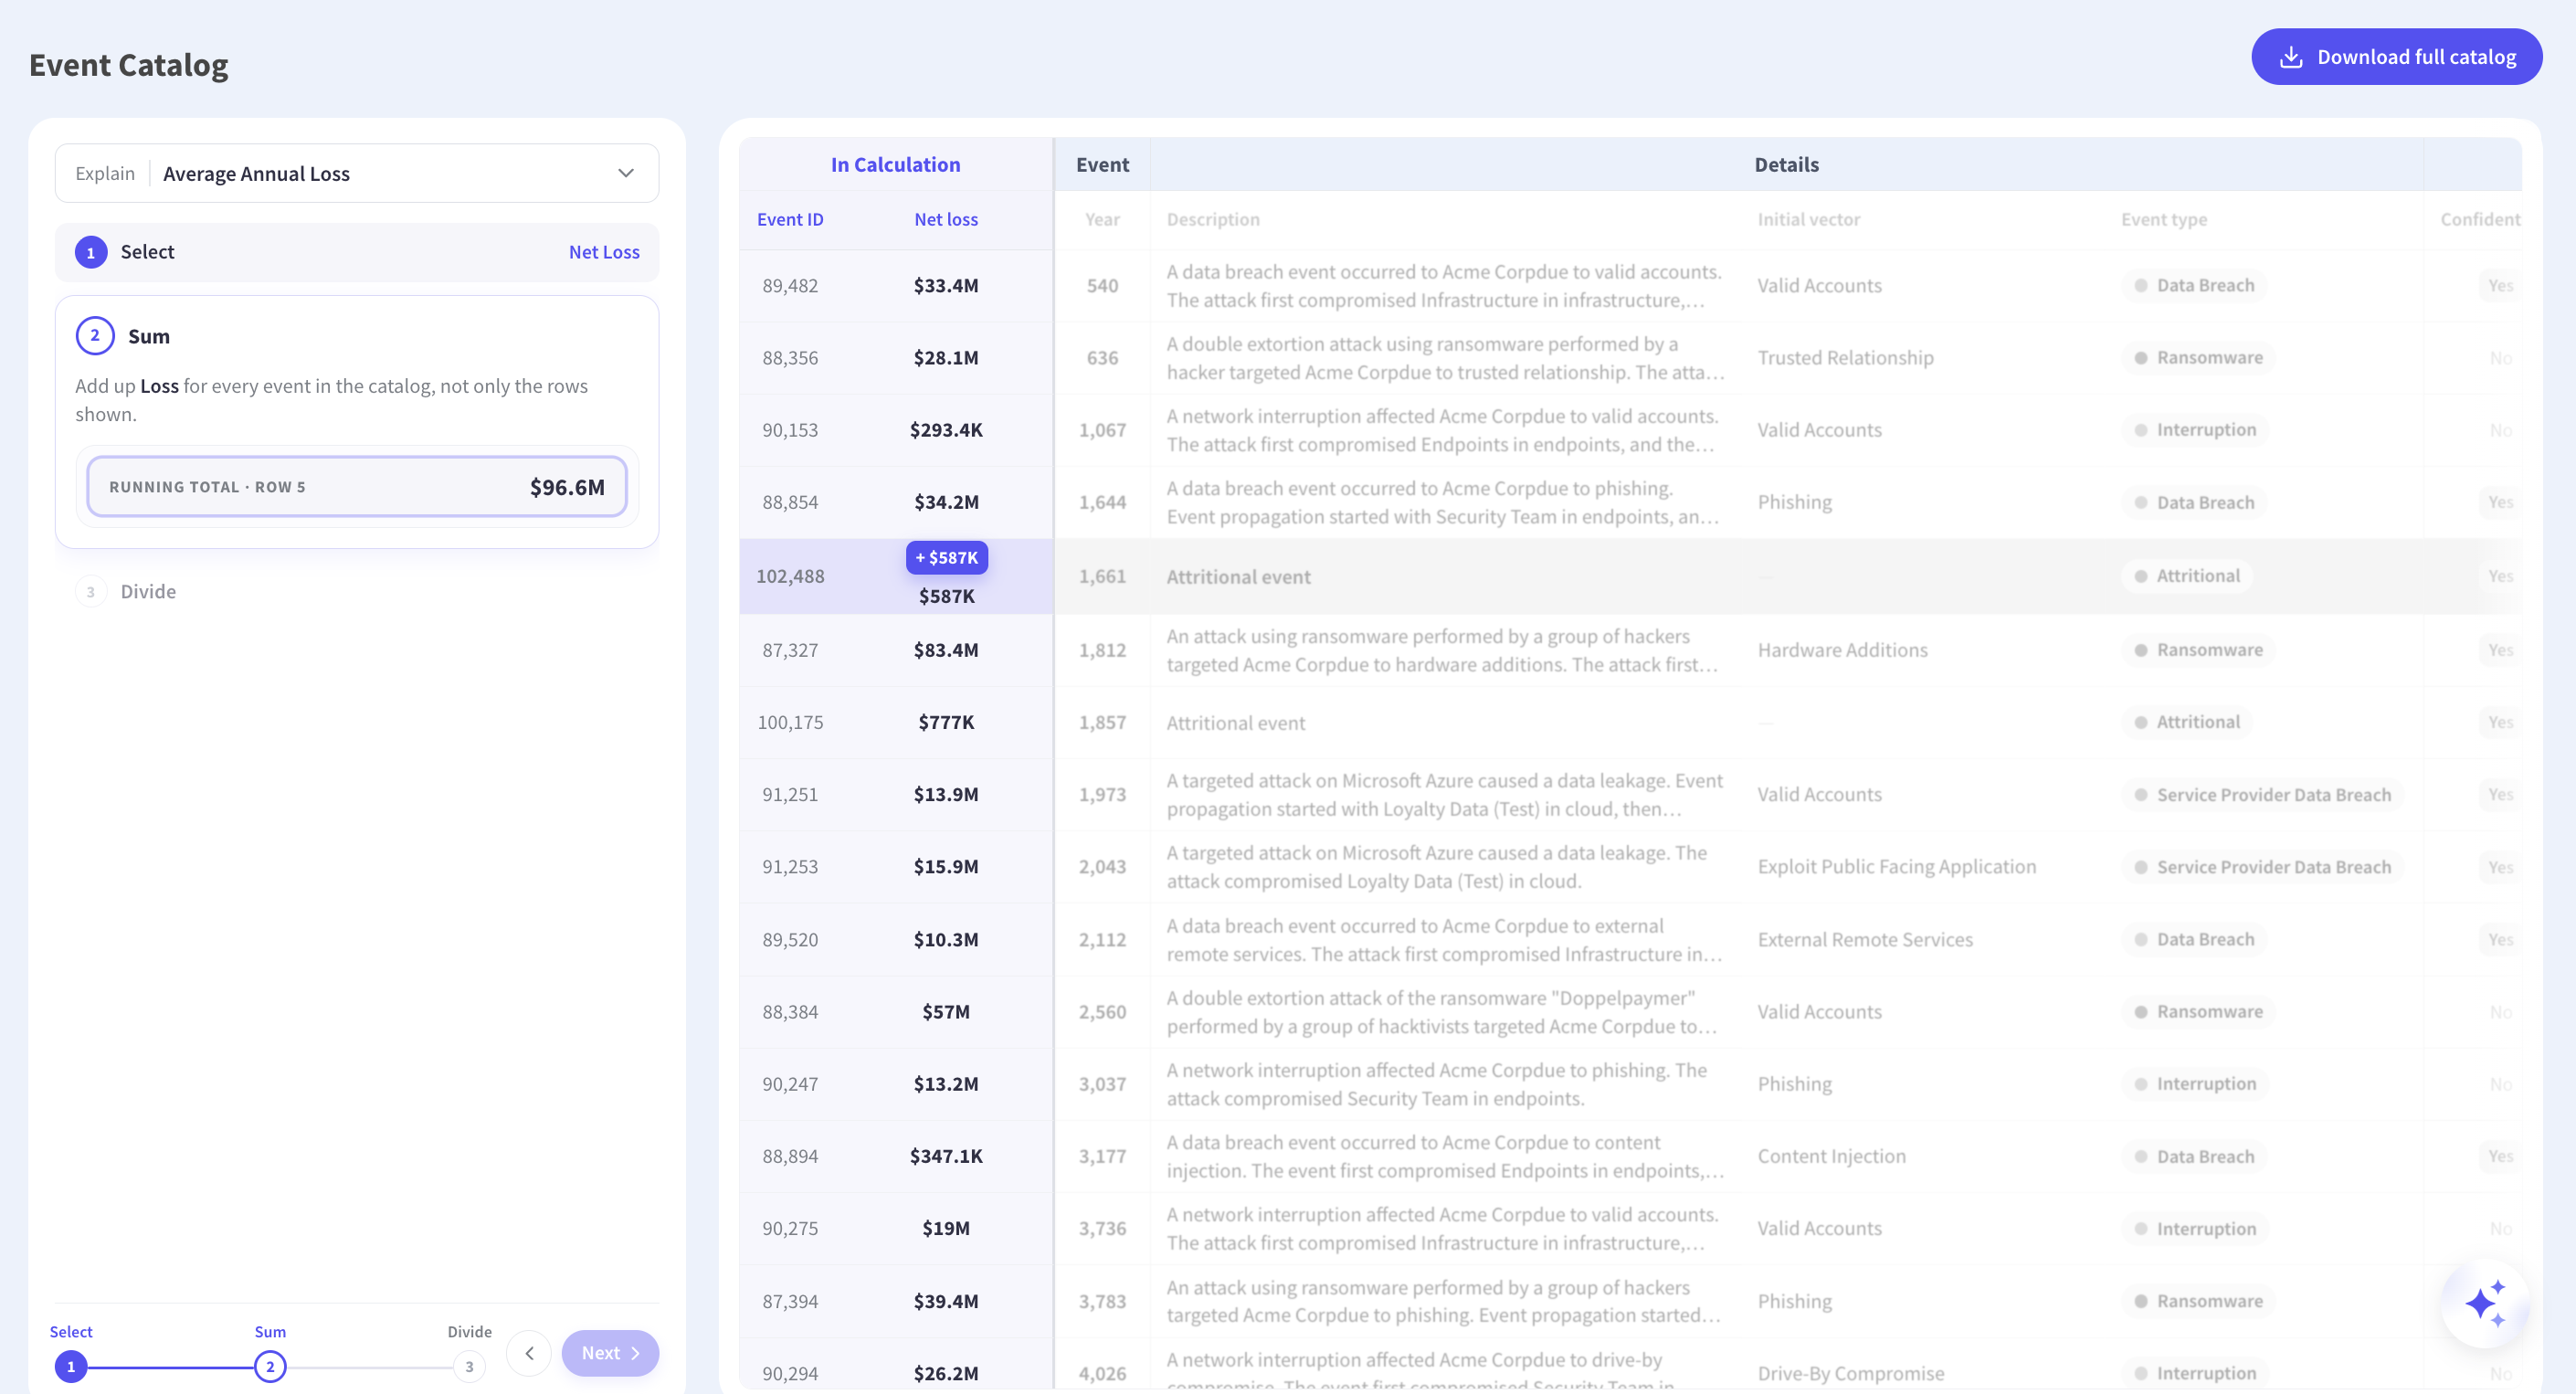
The figure resolves in three operations. Select the net loss column, sum it across every event in the catalog including the rows below the fold, then divide by the number of simulated years, counting the years in which nothing happened. That last step is why average annual loss is not a forecast for next year, and seeing the empty years enter the denominator makes the distinction hard to miss.
The Tail Figure Comes From Ranked Years
The 1-in-100 annual loss totals each simulated year, ranks all 25,000 of them, and marks the value sitting at the worst one percent. The worse years above that threshold are listed alongside it, which settles the common misreading of a return period as a schedule. A figure at that threshold describes how bad a year can get when one goes badly, and the years ranked above it describe how much further the tail runs once it does.
What Stays Closed?
The source list stays closed for contractual reasons. Some feeds arrive through partnerships reserved for modeling use, so attribution is published at category level and the named list goes to customers. The inputs are proprietary, which is why they carry information a public dataset does not, and everything built on top of them is open to inspection. Nobody has to accept the inputs on faith to check the output, because the check happens on the rows the inputs produced.
What Should a Buyer Ask to Inspect?
Four things can be tested during an evaluation, before anything is signed. Each one is answerable in a live session, and a vendor who needs to come back to you on any of them has told you something useful about what the platform produces under pressure. None of the four requires a data science team to assess, which matters when the person running the evaluation is the person who will later defend the number.
- The event set. Whether the simulated events behind a figure can be listed, read, filtered and exported, or whether the output stops at a chart.
- The arithmetic. Whether a headline metric can be decomposed into the operations that produced it, against live rows from the quantification in front of you.
- The control step. Whether control posture is applied per event or as a single adjustment to a finished number.
- The model version. Whether each figure is recorded with the version that produced it, since a later movement cannot be attributed otherwise.
Those four separate a platform that documents its method from one that can show its work. A structured vendor evaluation covers the wider commercial questions around them, including the ones about support, integration, data residency and contract terms that decide how the platform lands once it is bought. The four above come first because a platform that fails them makes the commercial questions moot.
Traceability Is the Test
Which framework a platform names describes how it reasons, and whether its event set can be opened describes what anyone else can verify. The second is the question behind the black box label, and a table answers it where a white paper cannot. Kovrr’s loss data includes insurance claims reflecting losses that were paid, which is a different population from losses that were announced. A company’s own figures come from running its profile through 25,000 simulated years, drawing on all three catalog types. Every event that resulted is written to a row, and every headline metric resolves into operations performed on those rows. The sources stay proprietary and everything downstream of them stays open.
To follow a quantified figure back to the simulated events behind it, book a demo with our cyber risk experts.

CRQ Model Transparency FAQs
Speak to an ExpertIs Kovrr's cyber risk quantification model a black box?

Does Kovrr use FAIR?
Where does the loss data behind the model come from?
How is a company's event likelihood calculated?
What is the difference between base loss and net loss?